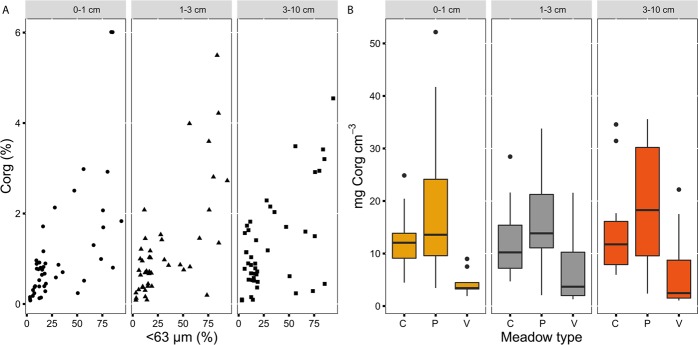
Figure 1.
Relationships among sediment carbon variables and drivers per each depth core section. (a) Biplot of Corg content (%) and sediment grain size <63 µm (%); (b) Boxplot of Corg stocks (mg Corg cm−3) and meadow type. Symbols for grain size: circle, depth section 0–1 cm; triangle, depth section 1–3 cm; quadrat, depth section 3–10 cm. Legend for meadow type: C, permanent continuous meadows; P, permanent patchy meadows; V, variable meadows.

