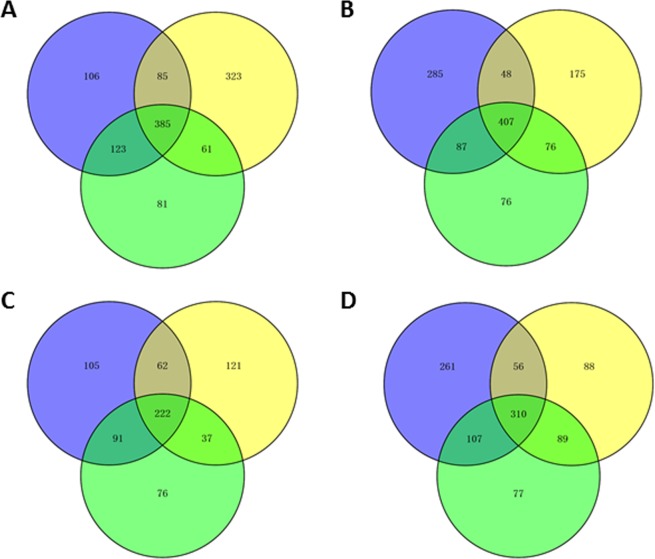
Figure 2.
Venn diagram comparing the number of significantly differentially up- or down-regulated genes during infection of Norway spruce in H. irregulare or H. occidentale. The purple, green and pink represent the number of significant up- or down-regulated genes from 2, 4 and 6 weeks after infection compare to liquid culture. The number of common and different up-regulated genes at 2, 4, and 6 weeks after inoculation compared with liquid culture of H. irregulare (A). The number of common and different up-regulated genes at 2, 4, and 6 weeks after inoculation compared with liquid culture of H. occidentale (B). The number of common and different down-regulated genes at 2, 4, and 6 weeks after inoculation compared with liquid culture of H. irregulare (C). The number of common and different down-regulated genes at 2, 4. and 6 weeks after inoculation compared with liquid culture of H. occidentale (D).

