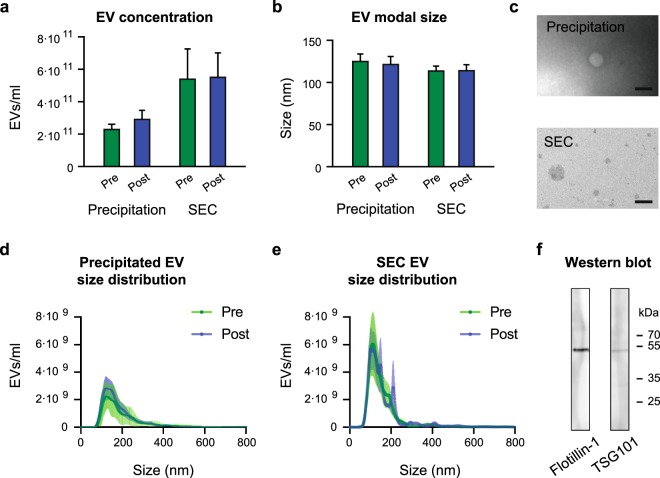
Figure 1.
Characterisation of EVs purified from plasma collected before and after BFRE. Using the NTA technology, the EV concentration (a) and size (b) were determined for the two purification methods, precipitation using the miRCURY Exosome Isolation Kit (0.5 ml plasma) or size exclusion chromatography (SEC) using qEVs (1 ml plasma) (mean +/− SEM, n = 6). Transmission electron microscopy (TEM) images of EVs (c), scalebar 200 nm. NTA generated size distribution of purified EVs using precipitation (d) and SEC (e). Full length Western blotting strips validating the presence of the EV markers Flotilin-1 and TSG101 (f).

