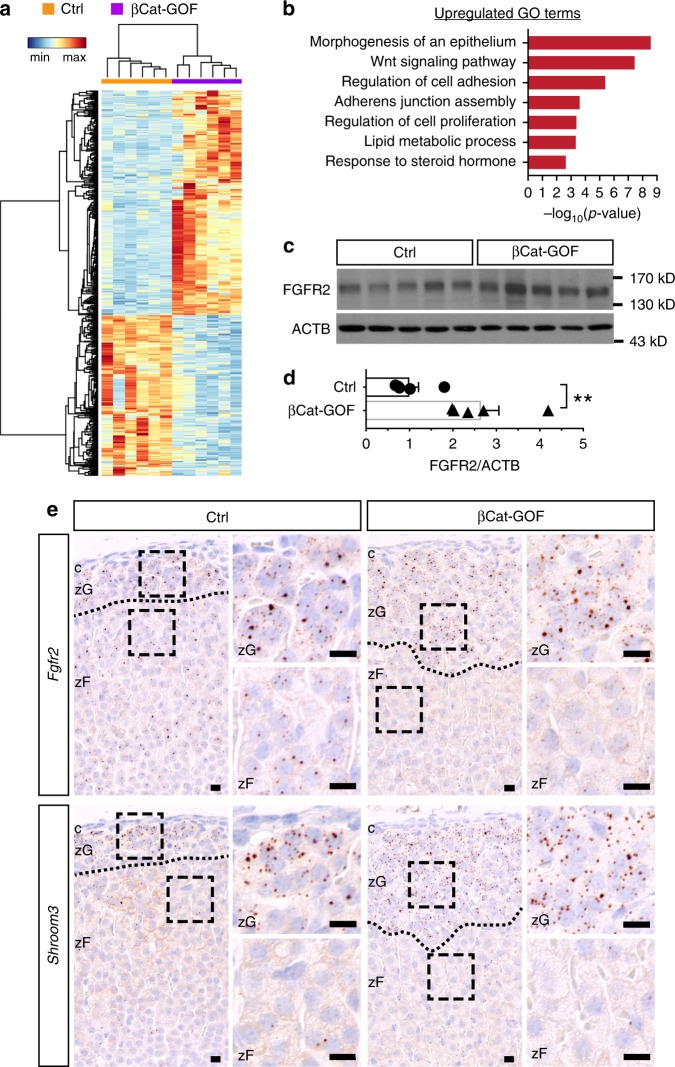
Fig. 6. Transcripts enriched in βCat-GOF regulate morphogenesis.
a Heatmap of differentially expressed genes between control (Ctrl) and βCat-GOF adrenals based on normalized counts. Fold change > 1.4, adjusted P value < 0.05, base mean expression > 100 were used as cut-off criteria. Dendrograms represent hierarchical clustering of samples (top, Spearman correlation) and genes (left, Pearson correlation) using the average linkage method. N = 6, 6 female mice. b Gene Ontology terms (Biological Processes) enriched in βCat-GOF adrenals. c Western blots showing increased FGFR2 in βCat-GOF adrenals compared to Ctrl. d Normalized luminescence intensity of (c). Student’s t test, **P < 0.01, N = 5, 5 female mice. e Single-molecule in situ hybridization (RNAscope) of Fgfr2 and Shroom3 in Ctrl and βCat-GOF female adrenals. Blue, hematoxylin counterstain. Dotted line demarcates zG/zF boundary; boxed areas are shown at higher magnification on the right. c capsule, zG zona glomerulosa, zF zona fasciculata. Bars, 10 μm. In all bar plots, error bars represent SEM. Source data are provided as a Source Data file.

