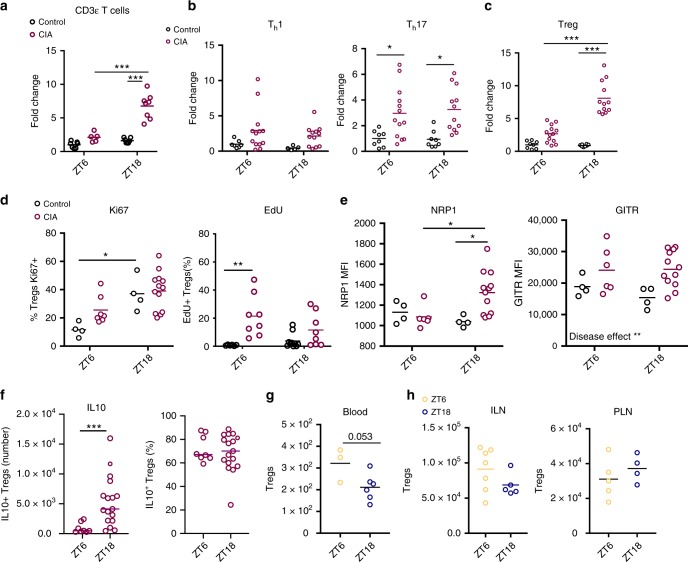
Fig. 2. Diurnal variation in T cell populations within inflamed joints.
a CD3ε T cells (CD45+/CD11b−/CD3ε+) in limbs harvested from control and arthritic mice at ZT6 (control n = 7; CIA n = 5) and ZT18 (control n = 7; CIA, n = 8), data normalised to CD3ε T cell numbers in control limbs at ZT6, two-way ANOVA and Bonferonni post hoc tests. b Quantification of CD4+ T cell subsets (Th1 and Th17) in limbs at ZT6 (Th1: control n = 7; CIA n = 13; Th17: control n = 8; CIA n = 13) and ZT18 (Th1: control n = 5; CIA n = 12; Th17: control n = 8; CIA n = 12), data pooled from two separate experiments and normalised to ZT6 control animals, two-way ANOVA and post hoc Bonferonni. c Quantification of Tregs in limbs at ZT6 (control n = 8; CIA n = 13) and ZT18 (control n = 8; CIA n = 12), data pooled from two separate experiments and normalised to ZT6 control animals, two-way ANOVA and post hoc Bonferonni. d Expression of the proliferation markers Ki67 (ZT6: control n = 4; CIA n = 7; ZT18: control n = 4; CIA n = 13) and EdU (ZT6: control n = 6; CIA n = 8; ZT18: control n = 10; CIA n = 8) on Tregs isolated from control and inflamed joints, Kruskal–Wallis test and post-hoc Dunn’s test. e Expression of NRP1 and GITR (ZT6: control n = 4; CIA n = 6; ZT18: control n = 4; CIA n = 12) on Tregs isolated from control and inflamed joints, two-way ANOVA and post-hoc Bonferonni test. NRP1—interaction between time-of-day and disease effect (p = 0.0285); GITR—disease effect (p = 0.0077). f IL10 expression by stimulated Tregs isolated from inflamed joints at ZT6 (n = 8) and ZT18 (n = 17) expressed as total number of IL10+ Tregs and % of Tregs that are IL10+, Mann–Whitney test. g Quantification of Tregs in blood of arthritic mice (ZT6 n = 3; ZT18 n = 6), two-sided unpaired T-test. h Quantification of Tregs in inguinal (ZT6 n = 7; ZT18 n = 5) and popliteal (ZT6 n = 5; ZT18 n = 4) lymph nodes from arthritic mice. Treg numbers were determined per lymph node, only popliteal lymph nodes draining inflamed limbs were analysed, two-sided unpaired T tests. All graphs show individual data points with mean values. In all panels statistical significance between indicated groups is shown as *p < 0.05, **p < 0.01 and ***p < 0.005. Source data are provided as a Source Data file.

