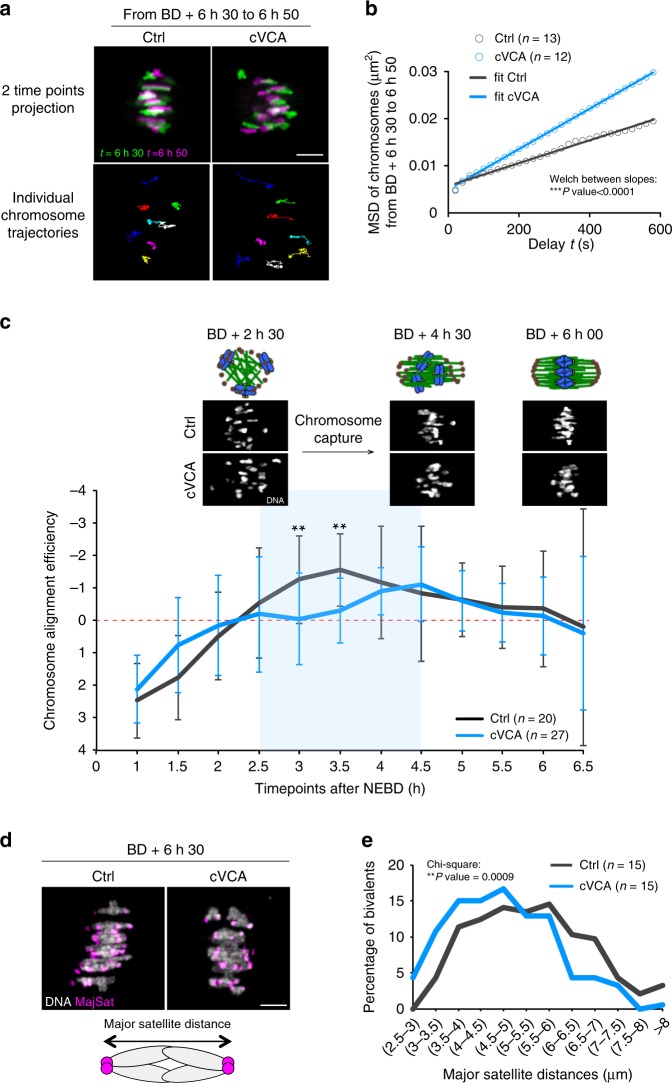
Fig. 3. Chromosome capture is less efficient in extra-soft oocytes.
a Representative temporal color-coded projections from time-lapse movies of a control and cVCA oocyte (upper panels). Scale bar: 5 µm. Bottom panels show individual chromosome trajectories corresponding to the upper panels. Each color represents one chromosome track. Four independent experiments. b Graph representing the mean square displacement (MSD) of individual chromosome between BD + 6 h 30 min and 6 h 50 min. Fifty-nine chromosomes among 13 controls and 60 chromosomes among 12 cVCA oocytes were analyzed. Data are from four independent experiments. MSD data are fitted to a simple linear regression model (R2 > 0.97). Statistical significance of differences of slopes between Ctrl and cVCA is assessed with a two-sided Welch’s test: ***P-value < 0.0001. c Graph representing the variation of elongation of the ellipse fitting the chromosomes between nuclear envelope BD (NEBD) and BD + 7 h 30 min for controls and cVCA oocytes. n is the number of oocytes analyzed. Data are from five independent experiments. The mean and SD are shown. Statistical significance of differences is assessed with a two-sided Wilcoxon’s test: **P-value = 0.005. The blue part of the graph corresponds to the chromosome capture phase. Images (chromosomes in white) and corresponding schemes (microtubules in green, DNA in blue, microtubule organizing centers in brown) are shown for BD + 2 h 30 min, 4 h 30 min, and 6 h. d Representative projections from time-lapse movies of control and cVCA oocytes at BD + 6 h 30 min expressing Histone(H2B)-GFP (gray) and MajSat-mClover (magenta). Scale bar: 5 µm. The scheme represents a bivalent (major satellite repeats in magenta). Five independent experiments. e Distribution graph representing the distance between major satellite repeats in live oocytes at BD + 6 h 30 min for controls and cVCA oocytes. One hundred and eighty-five chromosomes among 15 controls and 186 chromosomes among 15 cVCA oocytes were analyzed. Data are from five independent experiments. Statistical significance of differences is assessed with a two-sided χ2-test. **P = 0.0009.

