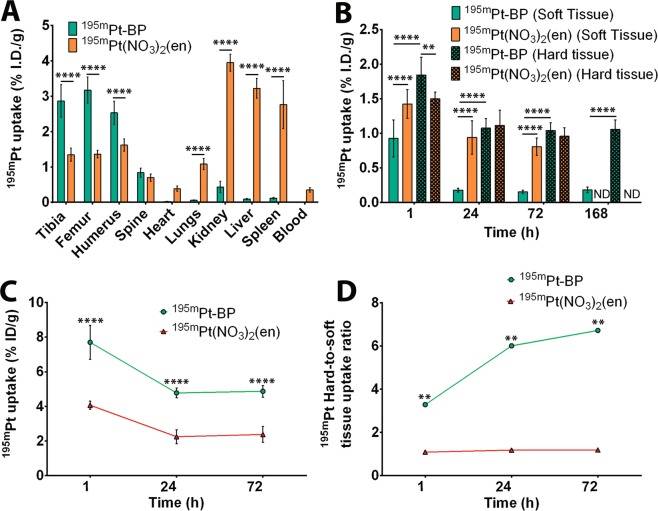
Figure 3.
Quantification of 195mPt-BP and 195mPt(NO3)2(en) biodistribution in vivo. (A) Percentage of injected dose (%ID/g) of 195mPt-BP (after 7 days) and 195mPt(NO3)2(en) (after 3 days) in mice determined using gamma counting. (B) Percentage of injected dose (%ID/g) of 195mPt-BP and 195mPt(NO3)2(en) in mice as quantified from the micro-SPECT/CT images in soft and hard tissues. (C) Percentage of injected dose (%ID/g) of 195mPt-BP and 195mPt(NO3)2(en) in mice as quantified from the micro-SPECT/CT images in the hard tissue region of interest (ROI) with the location of the edge of the ROI contour representing 75% of maximum intensity. (D) 195mPt hard-to-soft tissue uptake ratio excluding bladder uptake at 1 h. Data from 4–5 mice per group are presented. **P < 0.01; ****P < 0.0001 as determined by two-way ANOVA with a Bonferroni (multiple comparisons) post-hoc test. For the ratios, paired t-test was used to determine the differences among the two groups where **P < 0.01 was considered as significantly different.

