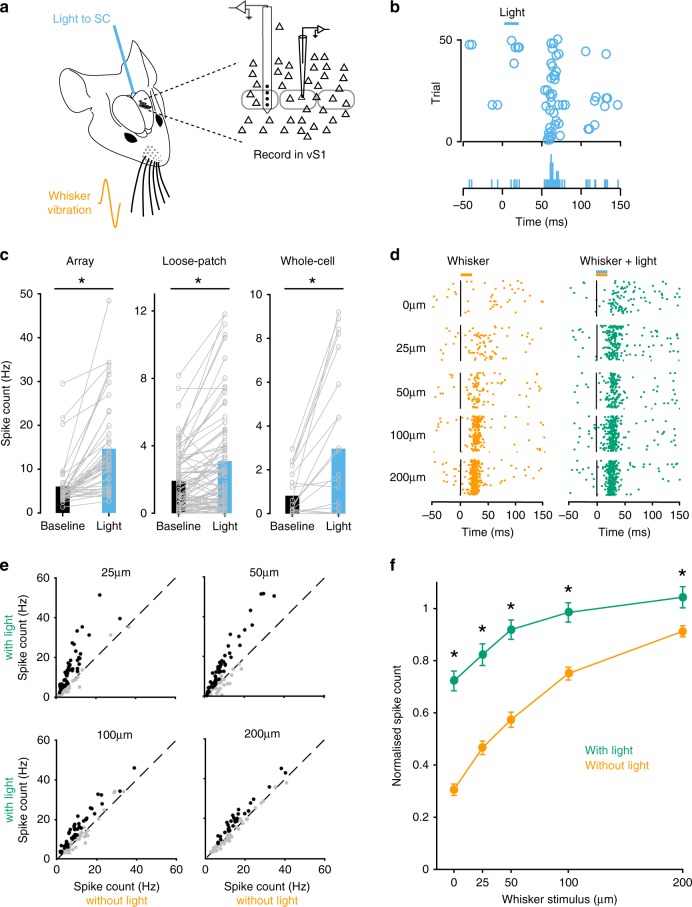
Fig. 2. Optogenetic activation of SC modulates vS1.
a Schematic of the experimental arrangement. Recordings were made from the vS1 while activating SC optogenetically via an optic fiber in the presence or absence of whisker vibration. b Raster plot (top) and peri-stimulus time histogram (bottom) during loose-patch recording from a neuron in vS1 (513 µm from the surface of the brain) showing increased spiking during SC stimulation. c Spiking of vS1 neurons increase significantly during light activation of SC (extracellular array recordings: n = 41; loose-patch recordings: n = 85; whole-cell recordings: n = 23). Asterisks represent p < 0.001 (Two-sided paired t-test). d Raster plot of action potential firing during extracellular recording from a vS1 neuron (589 µm from the surface of the brain) during whisker movement of different amplitude alone (orange dots; left) and with light activation of SC (green dots; right). e Plot of action potential firing in whisker responsive vS1 neurons (n = 127) with and without light activation of SC during whisker stimulation of different amplitude. Black symbols indicate a significant increase in firing during SC activation (n = 101; ROC analysis). f Pooled data showing the impact of SC activation (green) on the whisker input–output relationship (orange). Only neurons that were responsive to both whisker and SC stimulation were included in this analysis (n = 101 neurons). Asterisks represent p < 0.001 (Two-sided paired t-test). The spiking of each neuron was normalized to the maximum response to whisker stimulation alone. Error bars represent SEM. Source data are provided as a Source Data file.

