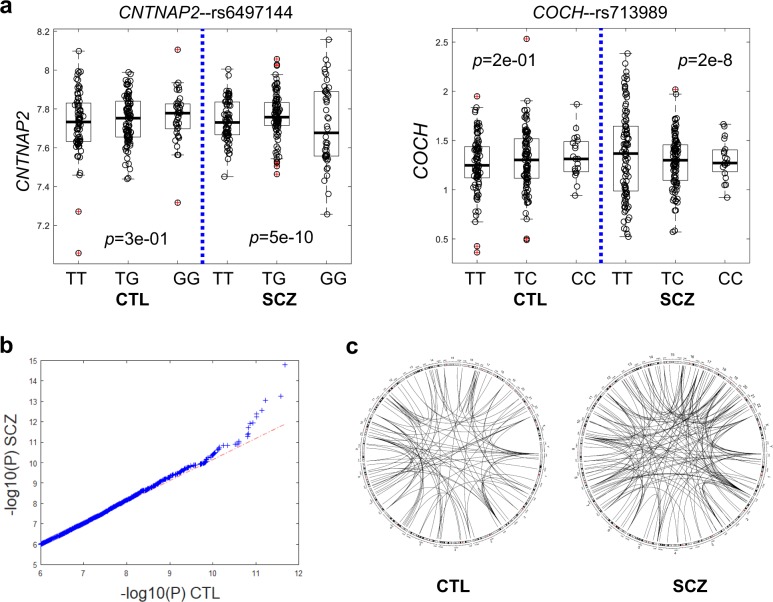
Fig. 3. Genetic variants associated with gene expression variability in SCZ.
a Two examples of SCZ-specific evQTLs, showing significant differences in expression variances between genotypes in SCZ but not in CTL. P-values of the B–F test for three genotype groups in SCZ and CTL, respectively, are given. b Quantile-quantile plot of P-values for evQTL associations in SCZ (y-axis) against those in CTL (x-axis). c Difference in the density of highly significant evQTL associations between variants and genes in SCZ and CTL.

