Figure 2.
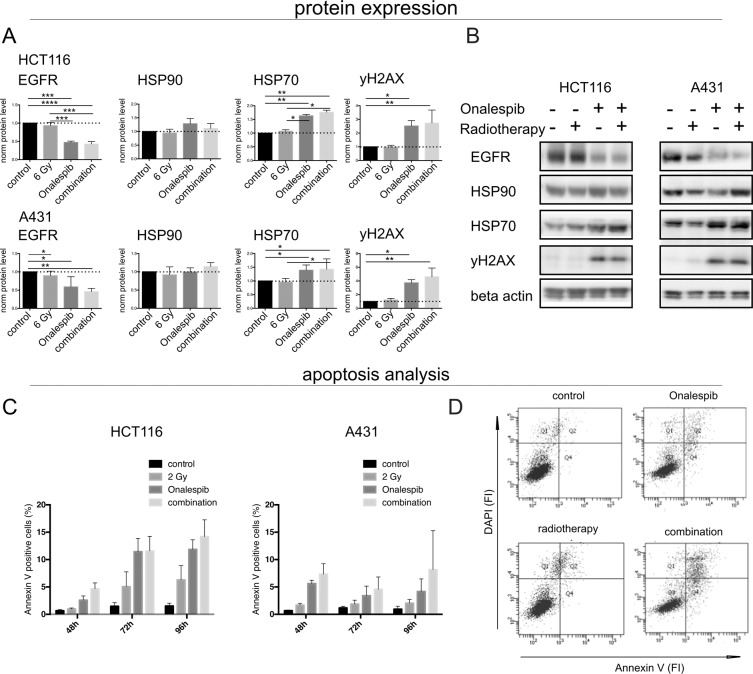
(A,B) Protein expression and apoptosis analysis. Western blot analysis of HCT116 and A431 cells. (A) Expression analysis of the above-mentioned proteins for HCT116 and A431 (normalized density), n > 3 error bars = SD. (B) Representative bands of the expression levels of EGFR, HSP90, HSP70, γH2AX and the housekeeping protein (loading control) beta actin 24 h after treatment. Images display cropped blots gathered with exposure times applied equally across the entire image, however different for different membrane fragments of the assessed proteins. All images are taken from membranes of the same lysates. (C,D) Flow cytometry analysis, of Annexin V expression. (C) Annexin V expression plotted as % positive cells after 48, 72 and 96 h treatment. n > 3, error bars = SD. (D) Representative image of Annexin V and DAPI analysis as fluorescence intensity (FI) for A431 cells at 48 h.

