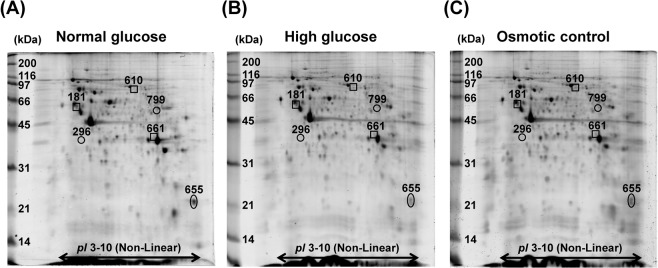
Figure 2.
2-D proteome map of differentially expressed mitochondrial proteins. (A–C) Representative 2-D gels, stained with Deep Purple fluorescence dye, of mitochondrial proteins under normal glucose, high glucose, and osmotic control, respectively (n = 5 gels were derived from 5 individual culture flasks for each condition; a total of 15 gels were subjected to comparative analysis). Differentially expressed proteins are labelled with numbers, which correspond to those reported in Tables 1 and 2.

