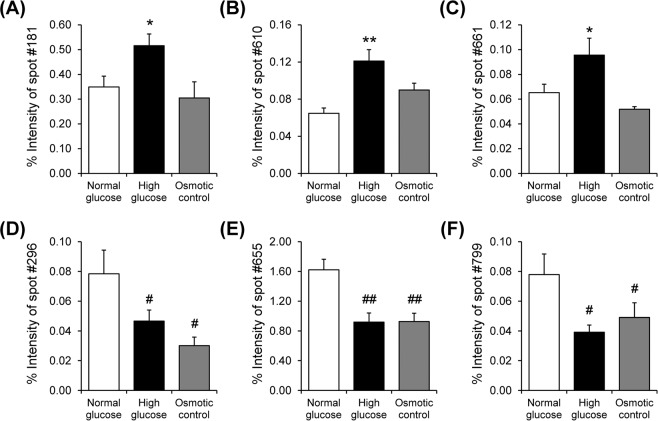
Figure 3.
Intensity levels of differentially expressed protein spots. (A–C) Intensity levels of spots no. 181, 610, and 661, respectively, which were increased exclusively in high glucose condition. (D–E) Intensity levels of spots no. 296, 655, and 799, respectively, which were decreased in both high glucose and osmotic control conditions. Each bar represents mean ± SEM of intensity data obtained from five gels per group. *p < 0.05 vs. normal glucose and osmotic control; **p < 0.01 vs. normal glucose and osmotic control; #p < 0.05 vs. normal glucose; ## p < 0.01 vs. normal glucose.

