Figure 6.
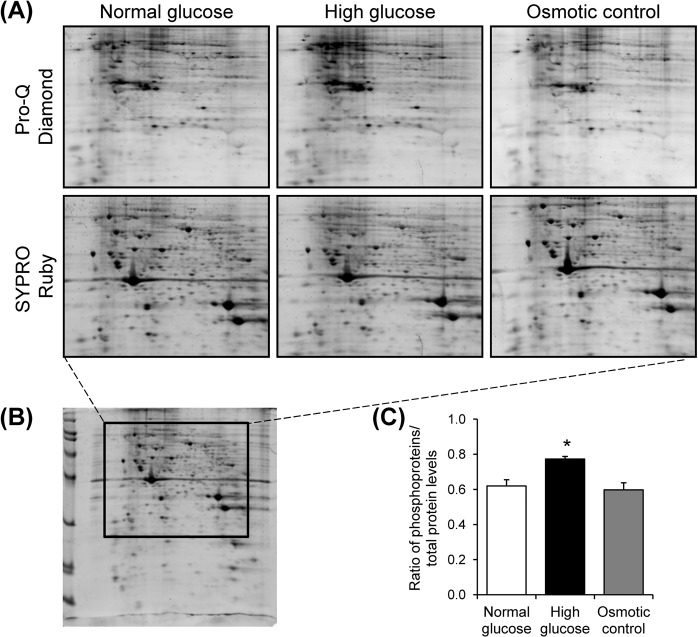
Detection and quantitative analysis of mitochondrial phosphoproteins. (A) Zoom-in images of representative 2-D gels, stained with Pro-Q Diamond phosphoprotein gel stain followed by SYPRO Ruby total protein gel stain, of mitochondrial proteins under normal glucose, high glucose, and osmotic control, respectively (n = 3 gels were derived from 3 individual culture flasks for each condition; a total of 9 gels were analyzed). The full-length gels of these zoom-in images are shown in Supplementary Fig. S4. (B) Demonstrates the whole 2-D gel, of which 2-D spot pattern was consistent with that of the Deep Purple stained gels used for initial comparative analysis (shown in Fig. 1). (C) Quantitative analysis of levels of phosphoproteins (Pro-Q Diamond) in relative to (normalized with) total protein (SYPRO Ruby) detected in each group. Each bar represents mean ± SEM of intensity data obtained from three individual gels per group. *p < 0.05 vs. normal glucose and osmotic control.

