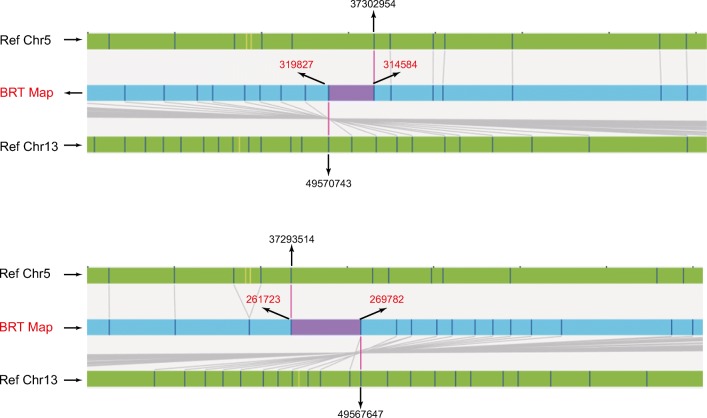
Fig. 1.
Bionano map showing breakpoint analysis of BRT01 [46,XY,t(5;13)(p15;q22)]. Chromosome 5 and 13 reference maps aligned to the BRT map are shown by arrows. The chromosome and genome map locations identified in the translocation regions are labeled. Coordinates in black are the hg19 locations; those in red are the genome map position for DLE labeling sites

