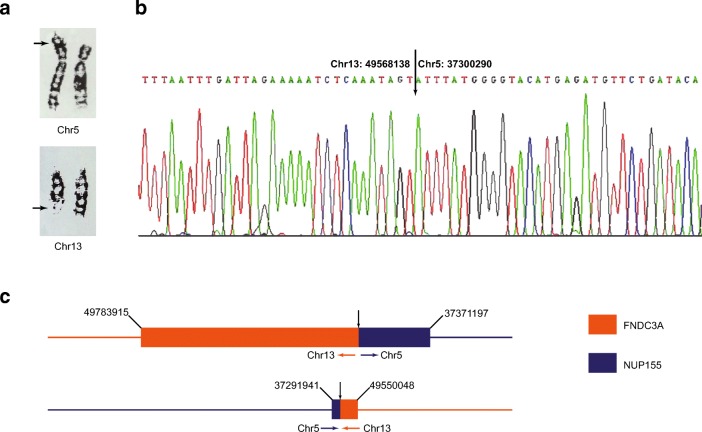
Fig. 2.
Breakpoint validation of BRT01 [46,XY,t(5;13)(p15;q22)]. a Karyogram of chromosomes 5 and 13. Arrows indicate the cytogenetic breakpoints of the translocation chromosomes. b Sanger sequencing. The actual BP positions on chromosomes 5 and 13 are defined. c Genome map showing disruption of two genes FNDC3A and NUP155 as a result of the translocation event. Numbers represent corresponding coordinates from the hg19 reference genome

