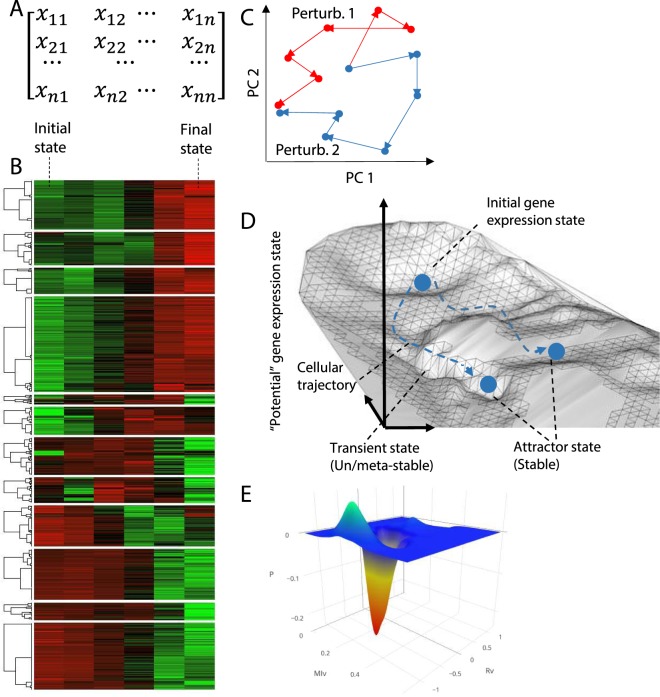
Figure 1.
Schematic illustration of attractor landscape and cellular trajectory. (A,B) Cellular gene expression profile represented by (A) matrix and (B) heat map of gene expression level. Each element represents the expression level of a gene (rows) in a cellular state (columns). (C) Schematic representation of cell trajectory convergence on principal components 1 and 2 (denoted as PC1 and PC2) space. Each point represents a sample’s entire gene expression profile within one of the two transitioning processes caused by two distinct perturbations13. (D) The landscape is a schematic 3-D projection of N (total number of genes) to a two-dimensional state space. In the attractor landscape, many stationary attractors (represented by the local minima), which correspond to the natural cellular phenotypes such as cell fate, might co-exist. Each attractor associates with a unique cellular signature profile (or gene expression profile in this study). The transitioning processes (dashed blue line) guide the cell from one stable attractor to another57. (E) Gene expression attractor landscapes generated by the superimposition of probability distribution of Pearson and mutual information correlation mertics to create a 3-D space18. Existence of stable attractor coinciding the convergence of cellular trajectories is indicated by the local minima.

