Figure 2.
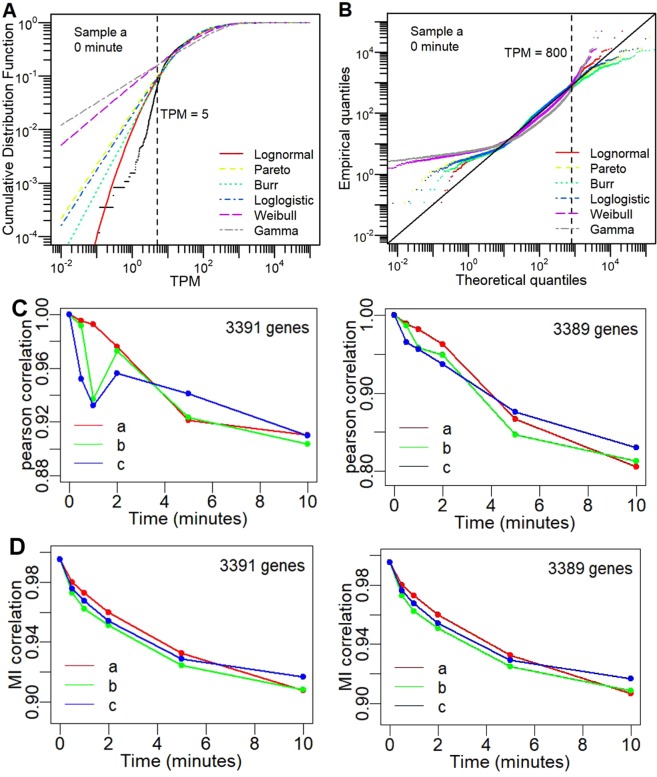
E. coli transcriptome-wide statistical properties. (A,B) Comparison of transcriptome-wide data with statistical distributions: (A) Cumulative distribution functions versus TPM values in logscale, and (B) Quantile-quantile plot between transcriptome data (experimental data – black colour) and lognormal (red), Pareto (yellow), Burr (cyan), loglogistic (blue), Weibull (purple), and gamma (grey) statistical distributions (Methods). Figure is one representative at t = 10 min for replicate a. See Fig. S1 for other time points and replicates. Transcriptome-wide correlation in time using: (C) Pearson correlation, and (D) Mutual Information-based correlation metrics (Methods) between time t0 (0 min) and ti (0, 0.5, 1, 2, 5, 10 min) for all 3 replicates (replicate a – red, replicate b – green, replicate c - blue) across 3391 genes with expression above 5 TPM (left panels) and 3389 genes upon removal of two highest expressed genes rnpB and lpp (right panels).

