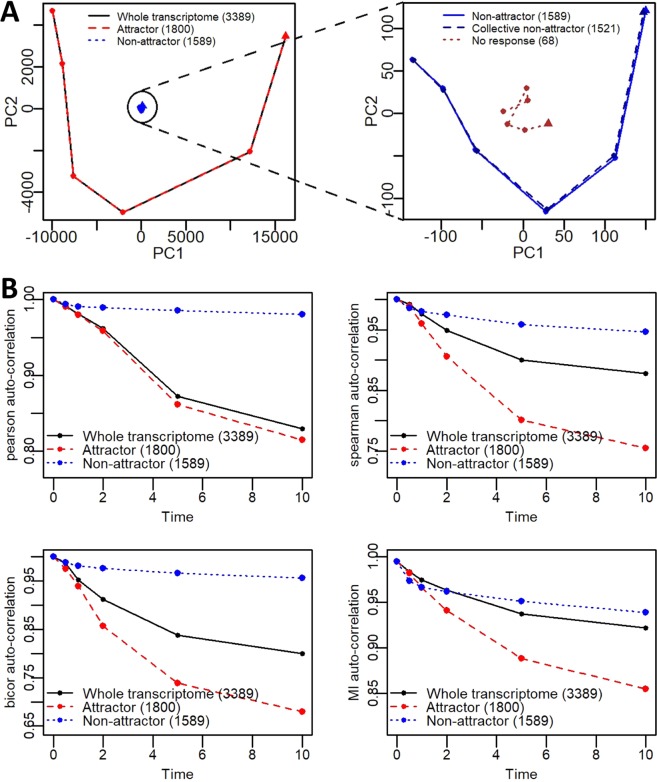
Figure 4.
Principal component (PC) analysis and auto-correlations of whole transcriptome attractor and non-attractor genes. (A) Gene expression trajectory of whole transcriptome (black), attractor (red), non-attractor (blue), and no response genes (brown), obtained by taking the average trajectories of 3 replicates, presented on first 2 principal components space. Right panel indicates non-attractor trajectory on a larger scale. (B) Temporal correlation of whole transcriptome (black), attractor (red), and non-attractor (blue) genes using Pearson (top left panel), Spearman (top right panel), Biweight midcorrelation (bottom left panel) and Mutual Information-based (bottom right panel) correlation metrics.

