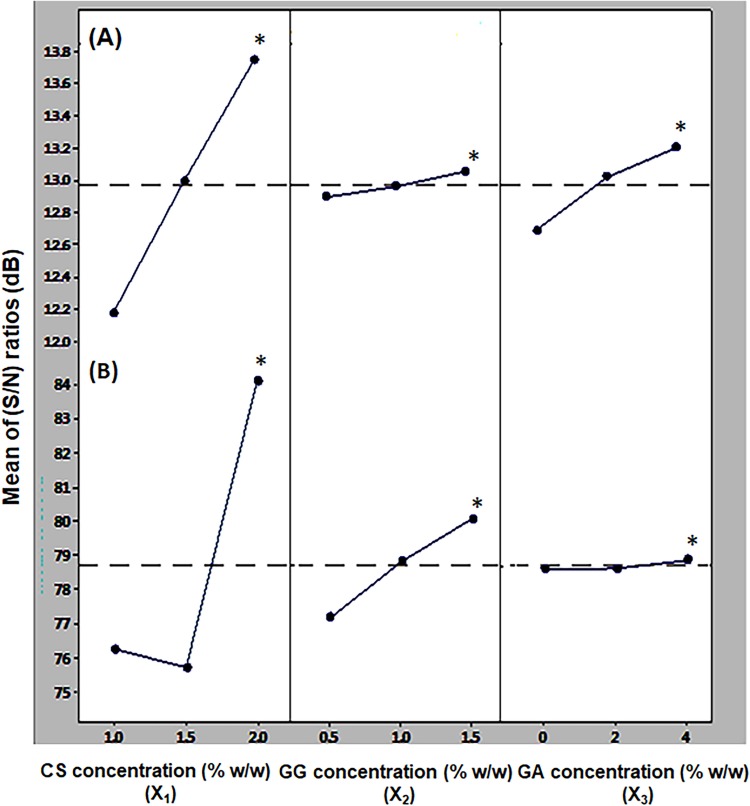
Figure 3.
Graphs illustrating the mean (S/N) ratios of the DMPs against the concentration of the different ICPs.
Notes: ((A) mean pH, and (B) mean η at γ of 192 s−1) See Table 4. *Points to the highest values.
Abbreviations: (S/N), signal-to-noise ratio; DMPs, dependently measured parameters; ICPs; independently controlled parameters; η, viscosity; γ, shear rate.

