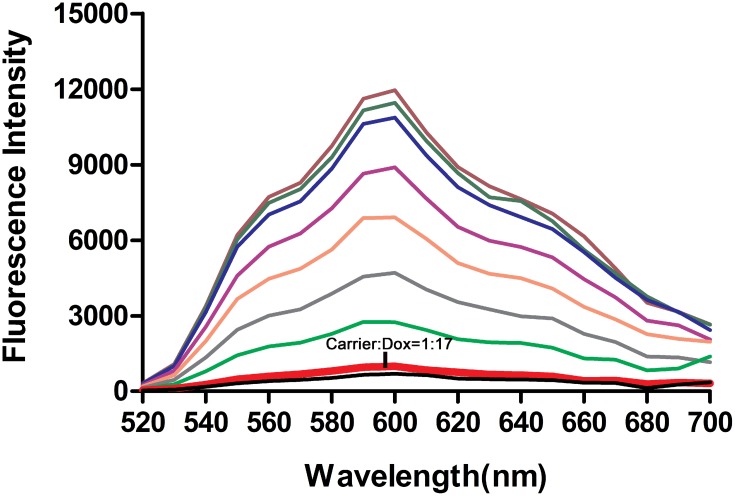
Figure 5.
Estimation of the drug-loading capacity of Apt-HJ. Fluorescence spectra of Dox were measured after incubation with increasing molar ratios of Apt-HJ (carrier/Dox ratios from top to bottom: 0, 1:5000, 1:500, 1:100, 1:50, 1:30, 1:20, 1:17, and 1:1). X-axis represented the wavelength. Y-axis represented the fluorescence intensity generated by free Dox molecules that did not intercalate into Apt-HJ. The fluorescence generated by Dox was largely quenched at the carrier/Dox ratio of 1:17 (thick red line pointed by arrow).

