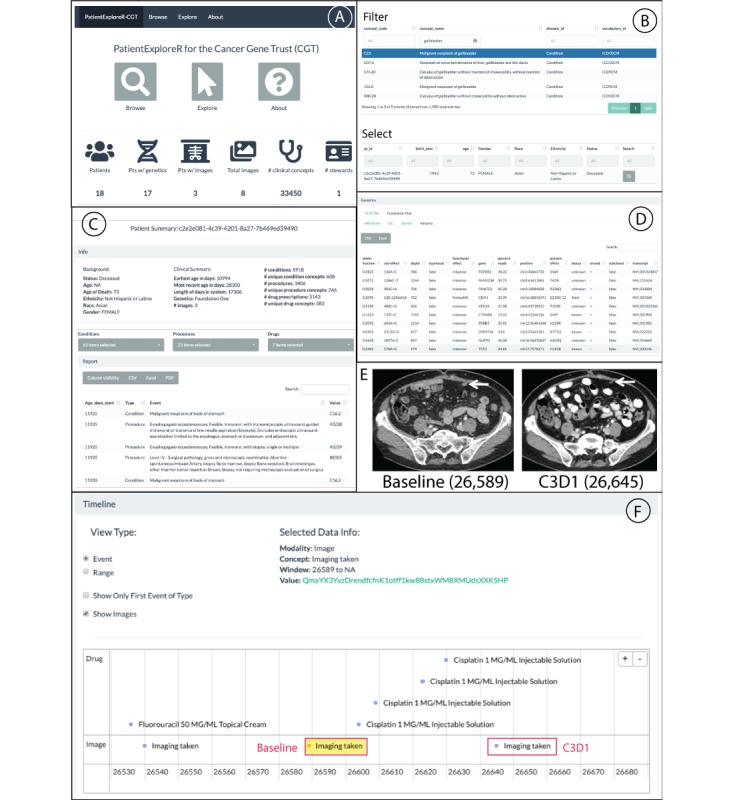
Figure 3.

PatientExploreR visualization app for Cancer Gene Trust (CGT). Breakdown of features available for the public PatientExploreR visualization application for CGT. (A) Landing page which has all options for browsing patients, exploring patient data, and information about CGT. This page also displays the amount of data currently compiled on CGT. (B) Browse tab for filtering for patient based on clinical concepts and/or demographics. This list is filtered by Gallbladder-related disease and patient c2e2e081-4c39-4201-8a27-7b469ed39490 was selected. (C) Explore tab that details patient’s background and clinical summary. The user can interact with clinical, genomic, and imaging data for selected patient. These data can be filtered and exported and control what is shown visually in the timeline view below. (D) Genomics data extracted and displayed from either the Foundation One or UCSF 500 report. (E) Two sample image scans that can be found via the imaging submenu or from clicking within the timeline view below. These CT scans show baseline and C3D1, 26,589 and 26,645 age in days, respectively. Baseline contrast enhanced CT of the abdomen shows a peritoneal metastasis (arrow) measuring 12×8 mm. Posttreatment contrast enhanced CT of the abdomen shows decreased size of the peritoneal metastasis (arrow) measuring 10×6 mm. (F) Timeline view of selected clinical and image data. This timeline view was produced by selecting the associated relevant medications in the Drug pull-down menu, specifically: capecitabine, cisplatin, fluorouracil, and trastuzumab. With Show Images selected, we can see what relevant medications the patient was prescribed when the images were taken. Pressing the link next to Value above, the user will be directed to all images taken during that visit, which can be viewed on an appropriate (eg, DICOM viewer) browser.
