
Figure 3.
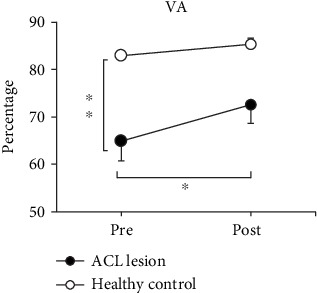
The mean ± SE of voluntary activation level (VA) before and after ES. The black circles (-●-) are ACL lesion legs, and the white circles (-○-) are legs of the healthy control group. VA is significantly increased following a 30-minute electrical stimulation (ES) only in ACL lesion legs. ∗Significant difference between pre- and post-ES (P < 0.05). ∗∗Significant difference between ACL lesion legs and legs of the healthy control group before ES (P < 0.05).