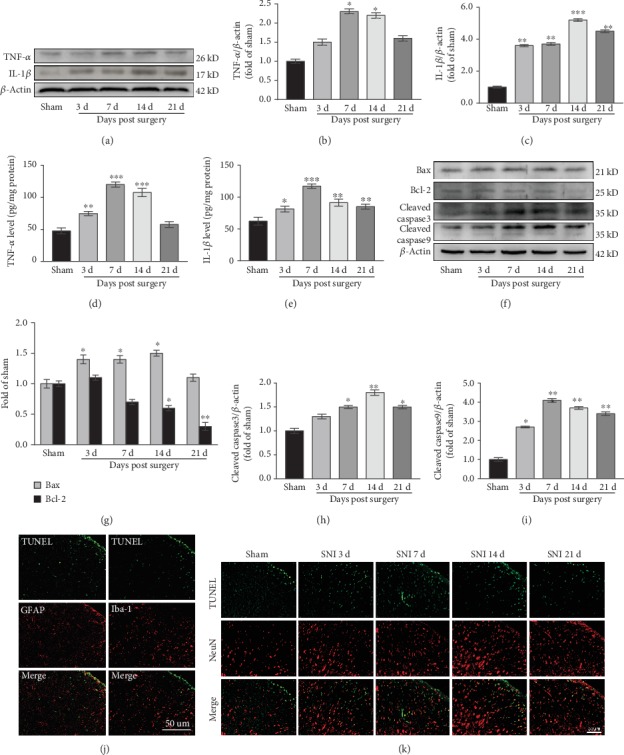
Figure 6.

SNI induces inflammation and apoptosis in the spinal cord. (a–c) Western blots and quantification of TNF-α and IL-1β expression in the spinal cord (n = 3). ∗P < 0.05, ∗∗P < 0.01, ∗∗∗P < 0.001 versus Sham group. (d, e) TNF-α (d) and IL-1β (e) levels in the spinal cord as measured by ELISA (n = 3). ∗P < 0.05, ∗∗P < 0.01, ∗∗∗P < 0.001 versus Sham group. (f–i) Western blots and quantification of bax, bcl-2, caspase3, and caspase9 expression in the spinal cord. ∗P < 0.05, ∗∗P < 0.01 versus Sham group. (j, k) Double labeling for TUNEL and GFAP, Iba-1, or NeuN. TUNEL-positive cells are mainly colocalized with NeuN (k), a small amount colocalizes with GFAP and Iba-1 (j). TUNEL-positive cells are green, NeuN, GFAP, and Iba-1 are red.
