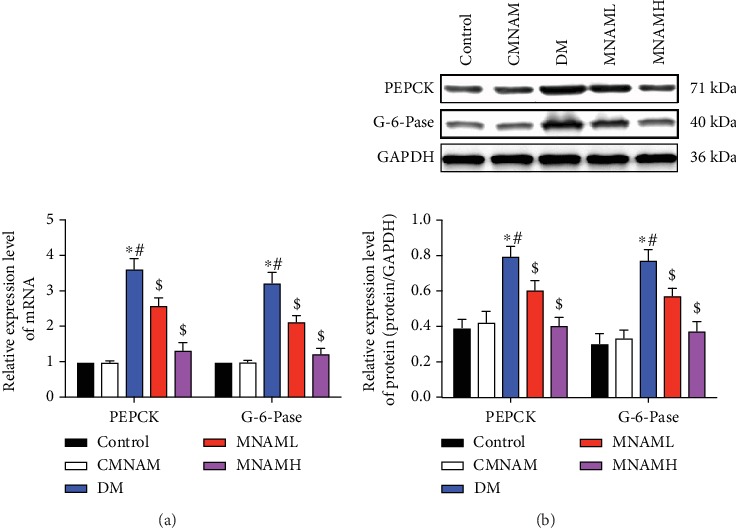
Figure 4.

MNAM reduces gluconeogenesis in the liver of obese T2DM mice (n = 10). (a) Real-time PCR was used to detect the mRNA expression of Pepck and G-6-Pase in the liver tissue of each group; (b) the expression of PEPCK and G-6-Pase in the liver of mice detected by Western blot. ∗Compared with the control group, P < 0.05; #compared with the CMNAM group, P < 0.05; $compared with the DM group, P < 0.05.
