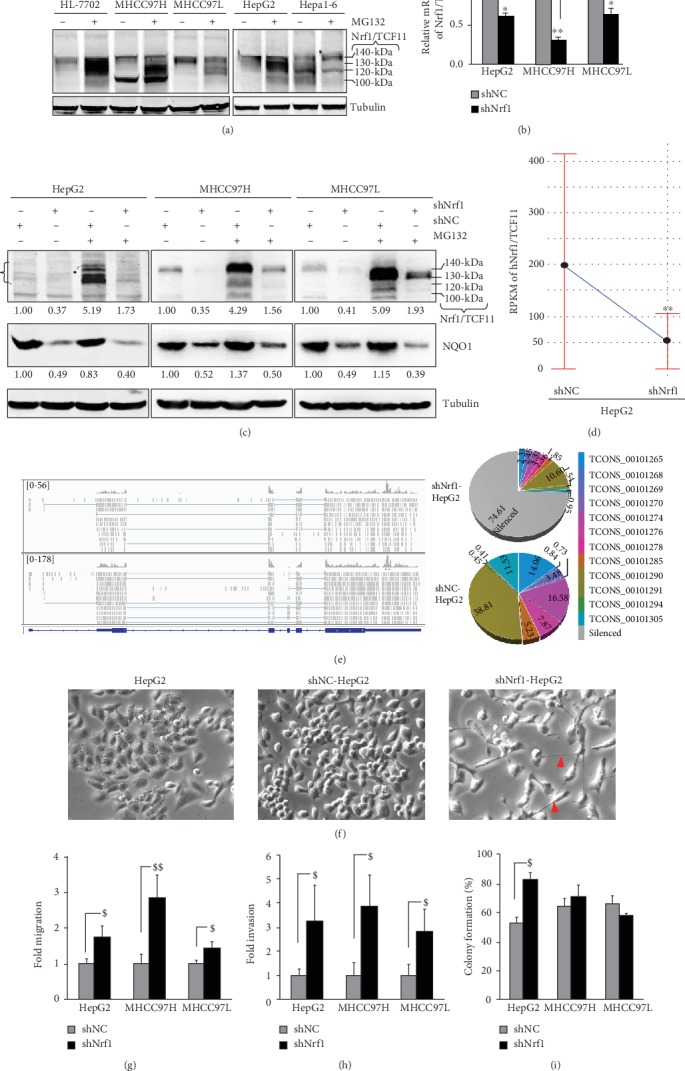
Figure 1.

Identification of stably expressing shNrf1 hepatoma cell lines with altered shapes and malignant behaviors. (a) Western blotting of hNrf1/TCF11 expression in a noncancerous HL-7702 and four hepatocarcinoma cell lines that were treated with 10 μmol/L of MG132 (+) or vehicle controls (-, DMSO) for 4 h. (b) Real-time qPCR analysis of the lentiviral-mediated knockdown of hNrf1/TCF11 by its short hairpin RNA (shNrf1) interference in three examined cell lines. The scrambled short hairpin RNA sequence serves as an internal negative control (shNC). The data are shown as mean ± SEM (n = 3 × 3), after significant decreases (∗p < 0.05; ∗∗p < 0.01) of shNrf1 relative to the shNC values were determined. (c) Western blotting of Nrf1/TCF11 and its target NQO1 in three pairs of shNrf1- and shNC-expressing cell lines that were treated with 10 μmol/L of MG132 (+) or vehicle control (-, DMSO) for 4 h. The intensity of the above immunoblots was quantified by the Quantity One 4.5.2 software and are shown graphically (in ). (d) Identification by transcriptomic sequencing of the hNrf1/TCF11 gene expression profiles of shNrf1- and shNC-silenced HepG2 cells. (e) The comparison of sequence reads (left panels) that were distributed to the genomic reference of the concrete and complete expression levels of the single hNrf1/TCF11 gene in the two samples of shNrf1- and shNC-HepG2 cell lines by using the IGV (Integrative Genomics Viewer) tool. A relative proportion of all the examined individual transcript isoforms of hNrf1/TCF11 was illustrated by each of the pie charts (right panels). (f) The morphological changes in the shape of HepG2 cells that had been transduced by a lentivirus containing shNrf1 or shNC, as well as its progenitor cells, were photographed in a low-power field (200x). (g) Fold migration and (h) invasion of shNrf1-expressing cells represent the mean ± SD of three independent experiments in triplicates (n = 3 × 3, in ). Significant increases ($p < 0.05; $$p < 0.01) were determined by one-way ANOVA analysis, relative to shNC controls. (i) Cell colonies on the plates were stained with 1% crystal violet reagent before being counted (). The data were calculated as a fold change (mean ± SD, n = 3; $p < 0.05) of the shNrf1-derived clone formation, relative to the shNC controls.
