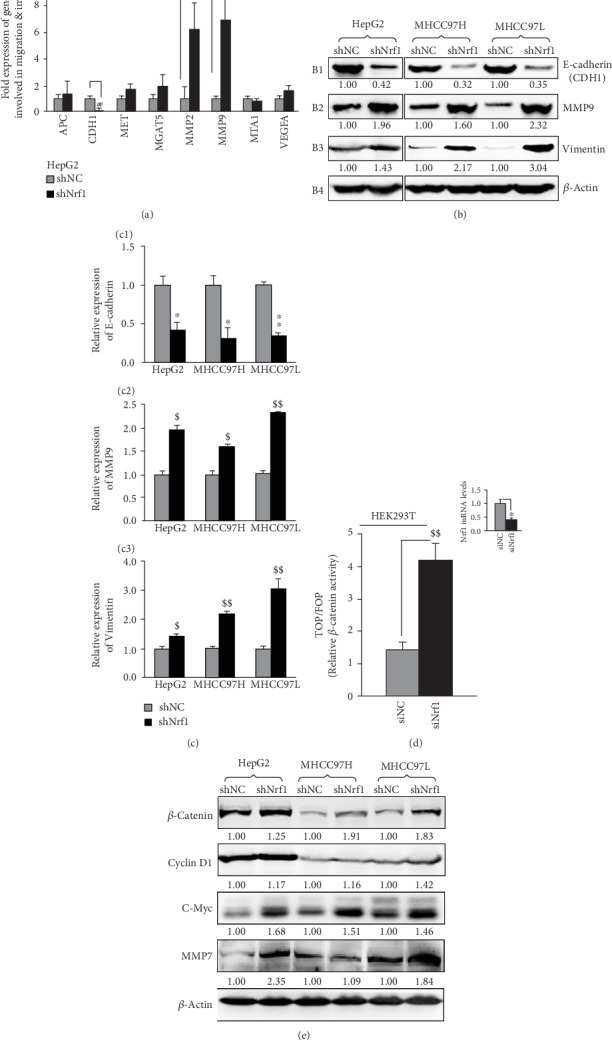
Figure 2.

Activation of β-catenin signaling pathway by knockdown of Nrf1 in hepatoma cells. (a) Real-time qPCR analysis of differential expression of those genes that are involved in migration and invasion of shNrf1- or shNC-transduced HepG2 cells. The data were shown as the mean ± SEM (n = 3 × 3). Significant increases ($$p < 0.01) or decreases (∗p < 0.05) were statistically calculated by comparison with the shNC controls. (b, c) Abundances of E-cadherin, vimentin, and MMP9 were detected by Western blotting with the indicated antibodies (b). The intensity of their immunoblots was quantified by the Quantity One 4.5.2 software (c). The data are representative of three independent experiments and also graphically shown as the mean ± SD (n = 3). Significant increases ($p < 0.05; $$p < 0.01) were caused by silencing of Nrf1, relative to the shNC control values. (d) The relative β-catenin/TCF-mediated luciferase activity was determined by measuring HEK293T cells that had been cotransfected with either TOPflash (wild-type) or FOPflash (a mutant that serves as a background control) along with specific siRNAs targeting to Nrf1 (siNrf1). In addition, knockdown of Nrf1 was validated herein. The data were shown as the mean ± SEM (n = 3 × 3). Knockdown of Nrf1 caused a significant increase of β-catenin activity ($$p < 0.01) and another significant decrease of Nrf1 (∗p < 0.05), which were statistically calculated by comparison with the control values obtained from siNC-transfected cells. (e) Basal abundances of β-catenin, Cyclin D1, c-Myc, and MMP7 in distinct pairs of the shNrf1- and shNC-derived hepatoma cell lines were visualized by Western blotting with their respective antibodies. Then, the intensity of their immunoblots was determined and shown on each of the bottoms.
