
Fig. 2.
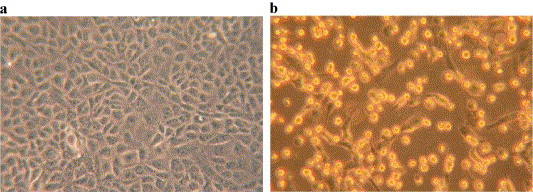
(a) Vero E6 cells were imaged before infection and (b) 32 h after infection with SARS-CoV at a multiplicity of 1 pfu per cell. Notice the extensive cell damage in b.
Official websites use .gov
A
.gov website belongs to an official
government organization in the United States.
Secure .gov websites use HTTPS
A lock (
) or https:// means you've safely
connected to the .gov website. Share sensitive
information only on official, secure websites.
(a) Vero E6 cells were imaged before infection and (b) 32 h after infection with SARS-CoV at a multiplicity of 1 pfu per cell. Notice the extensive cell damage in b.