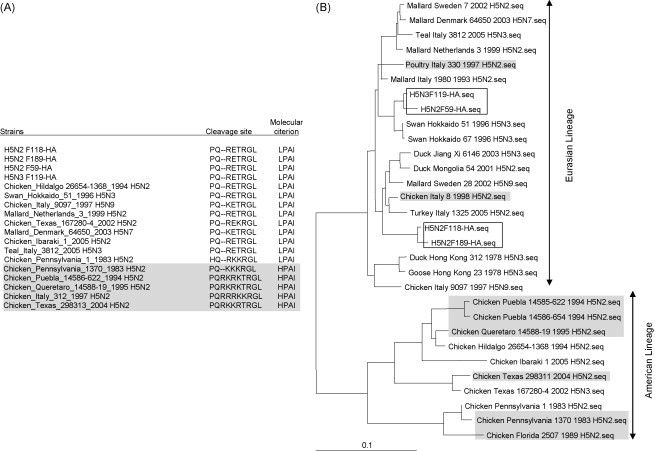
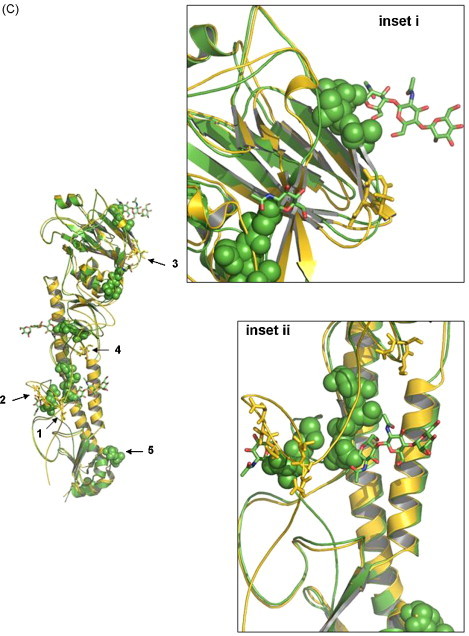
Fig. 1.


(A) Comparison of the HA cleavage site of various low and high pathogenic H5 influenza A viruses. The four low pathogenic AIV isolates that we have sequenced in this study are highlighted in bold and various HPAI H5N2 are highlighted in italics. (B) Phylogenetic trees of the full-length HA genes based on nt sequence alignment. The four LPAI H5 isolates F118, F189, F59 and F119 are boxed, while high pathogenic influenza isolates are highlighted in grey. (C) Overall structure of F118 monomer. The 3D models of F118 (H5) and 1HA0 (H3) were superimposed. Gold, F118; Green, 1HA0. The potential glycosylation sites postulated for F118 are shown in sticks and highlighted for regions 1–5, representing amino acids located at position 26 (NNST), 39 (NVT), 181 (NNT), 302 (NSS), and 496 (NGT) on the F118 HA model. Region 5 is overlapping with, and covered by aa residues from 1HA0. Amino acid located at 555 is not shown as the region has not been crystallized for the template we chose for the modelling. Regions 1–4 are found in the HA1, and region 5, in the HA2. (For interpretation of the references to color in this figure legend, the reader is referred to the web version of the article.)
