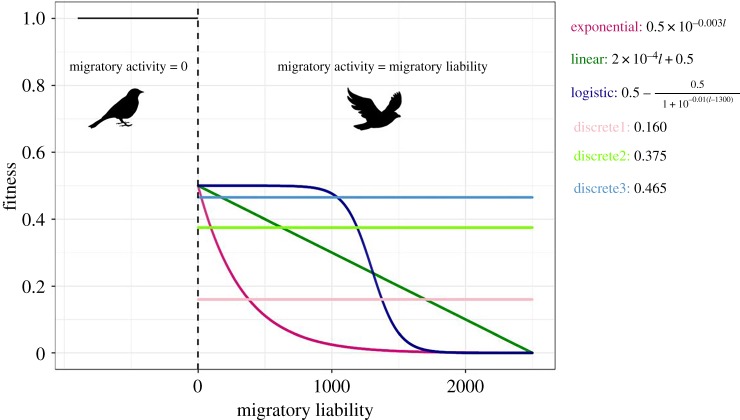
Figure 1.
Relationship between fitness and migratory liability for the fitness functions used in the simulations (distinguished by colour). The dashed line represents the migration threshold. Migratory liability of residents is smaller than this value, in migrants it is larger. Note that residents are given a fitness of 1 (horizontal line) under all fitness functions. (Online version in colour.)

