Figure 4.

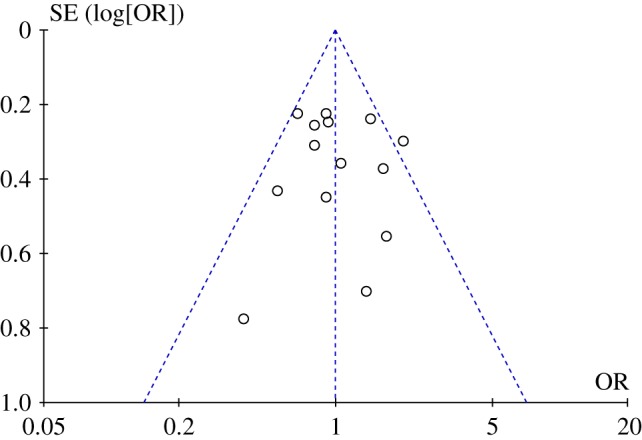
Funnel plot for the FFE odds ratios. The triangle formed by the dashed lines represents a 95% confidence interval. (Online version in colour.)

Funnel plot for the FFE odds ratios. The triangle formed by the dashed lines represents a 95% confidence interval. (Online version in colour.)