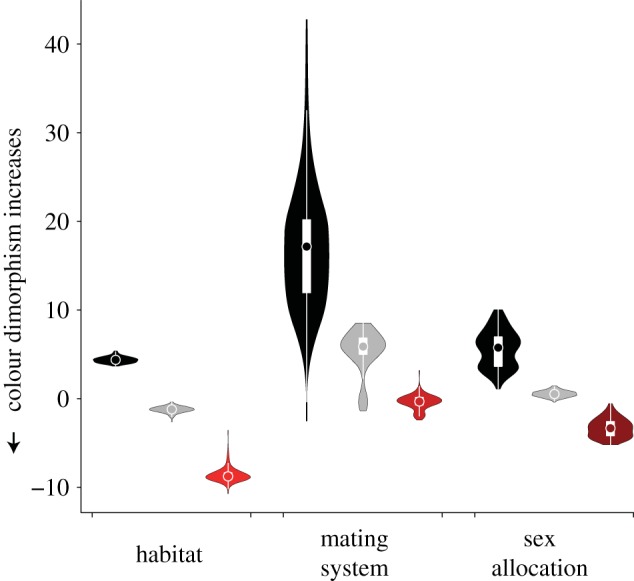
Figure 2.

The adaptive evolution of colour dimorphism. Median optimal colour dimorphism (coloured circles), interquartile range (IQR, white rectangles), 1.5 × IQR (white lines), and the kernel density corresponding to habitat association (black, non-coral reef; light grey, coral reef associated; dark grey/red, coral reef exclusive), mating system (black, promiscuous; light grey, haremic; dark grey/red, lek-like), and sex allocation (black, gonochorous; light grey, monandric; dark grey/red, diandric). Values were estimated from best-fit evolutionary models. Of the three predictor traits, habitat best explains the evolution of colour dimorphism, whereby colour dimorphism becomes more pronounced with increasing coral reef association. (Online version in colour.)
