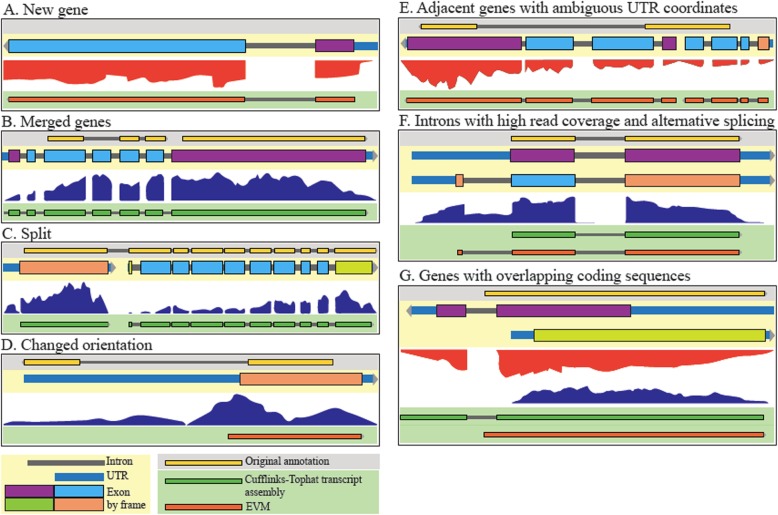
Fig. 1.
Manual gene model curation examples. Several tracks are shown: updated gene model (beige background), original (2005) gene annotation (grey background), RNAseq data (white background), transcript assembly (dark green, on green background), and EVM predictions (orange, on green background). a A new gene discovered on the basis of RNAseq data (TpMuguga_03g02005). b A case where two genes in the 2005 annotation merge in the new annotation on the basis of RNAseq read coverage (TpMuguga_04g02435). c A case where a gene in the 2005 annotation has been split into two genes in the new annotation (TpMuguga_04g02190 and TpMuguga_04g02185). d A case where a gene has been reversed in orientation on the basis of RNAseq data (TpMuguga_02g02095). e A case where overlapping genes led to ambiguity in UTR coordinates, and so the UTRs were not defined in this intergenic region (TpMuguga_01g00527 and TpMuguga_01g00528). f A case of a single gene where alternative splicing exists (as seen by significant read coverage in at least one intronic region), but there is one most prevalent isoform (TpMuguga_03g00622). g A case of two genes that overlap by coding sequences. Coding exons are colored by reading frame (TpMuguga_05g00017 and TpMuguga_05g00018)

