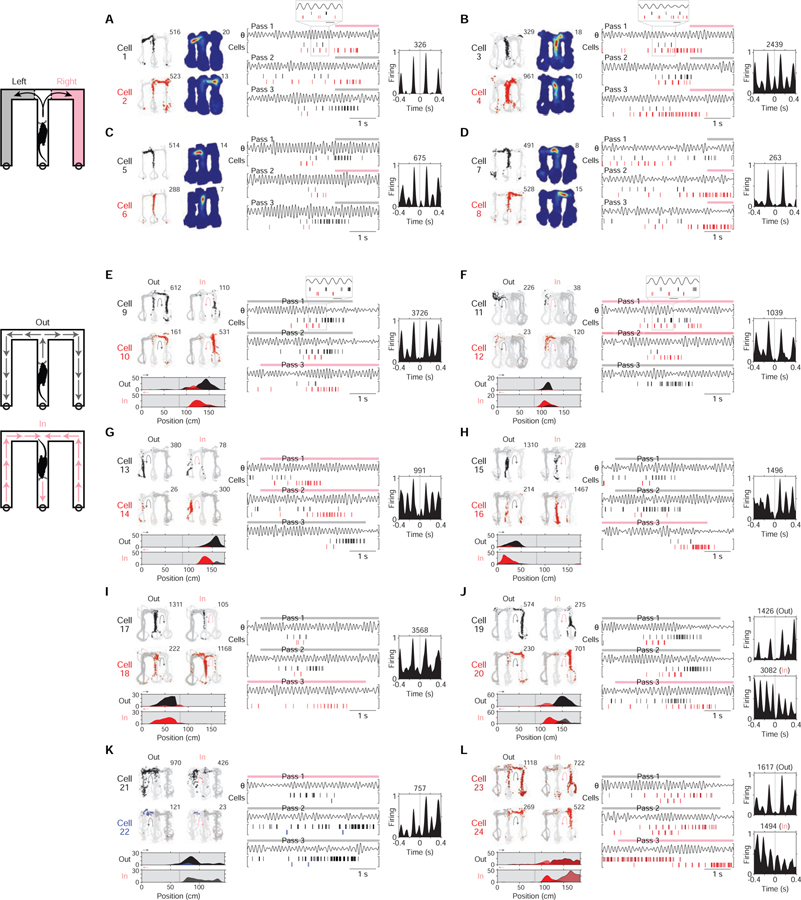
Figure 2. Constant cycling (8 Hz) in the hippocampus.
Example cell pairs showing constant cycling firing at 8 Hz.
(A-D) Four example cell pairs with differing locational representations (left (grey) vs. right (pink) arm; schematic at far left). Plotting conventions are the same as Figures 1E–J. Data from outbound maze passes, with data from left (grey) vs. right (pink) passes plotted separately. In (A) and (B), a portion of the data is expanded to help show the firing pattern (grey boxing; scale bar: 125 ms).
(E-J) Six example cell pairs with differing directional representations (outbound (grey, Out) vs. inbound (pink, In) direction; schematic at far left). Data from inbound vs. outbound maze passes plotted separately. Plotting conventions are the same as Figures 1E–J but with the following differences: black corresponds to outbound-preferring cells, while red corresponds to inbound-preferring cells; below, linearized (rather than 2D) time-averaged firing maps are plotted (arms plotted in linearized maps correspond to positions plotted as light grey in raw firing maps); in rasters, maze pass times are indicated above plots by colored bars. In (E) and (F), a portion of the data is expanded to help show the firing pattern (grey boxing; scale bar: 125 ms).
(K and L) Two example cell pairs with similar locational and directional representations. Data from inbound (pink) vs. outbound (grey) maze passes (schematic at far left, shared with that of E-J), with passes of each direction plotted separately. Plotting conventions are the same as (E-J), but firing data from cell 26 is shown in dark blue to denote outbound preference (same preference as cell 25), and firing data from cell 27 is colored in dark red to denote inbound preference (same preference as cell 28). In the example in (L), two XCGs are plotted, one for each (directional) condition; notably, anti-synchronous cycling firing is seen only in one condition. Note that (K) and (L) are suggestive of a representational correlate, different from location and direction, that may be associated with cycling firing.
Recording regions: CA1: cells 3–6, 11–14, 16–17, 19; CA2: cells 9, 18, 23; CA3: cells 1–2, 7–8, 10, 15, 20–22, 24.

