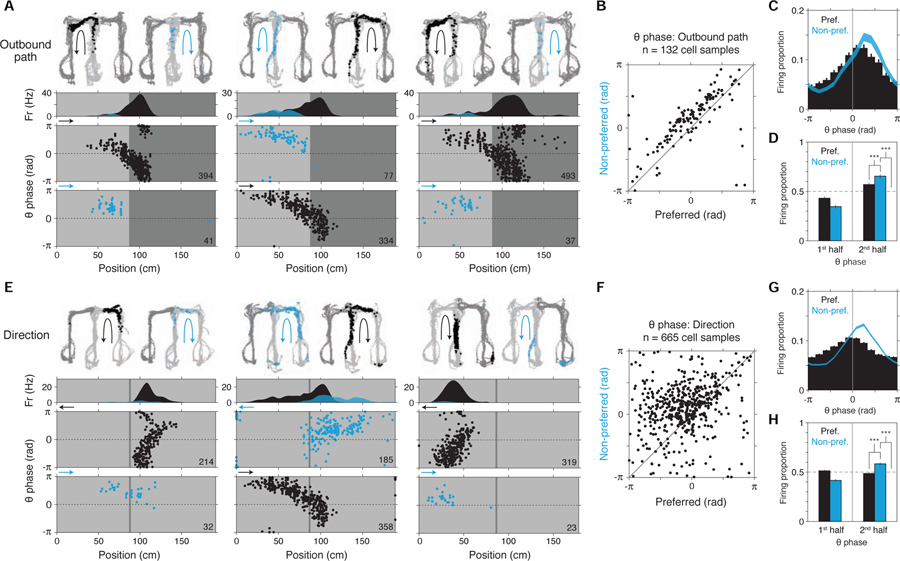
Figure 6. Intra-cycle coding of hypotheticals: summary.
Additional examples and study-wide quantification of outbound path (A-D) and direction (E-H) representation in single cells. Across all plots, firing data are colored based on the condition in which they occurred: preferred (black) vs. non-preferred (blue).
(A) Outbound path-coding cells. Plotting conventions are the same as in Figure 5A. Recording regions, left to right: CA3, CA2, CA1.
(B) Scatter of mean theta phase (n = 132 cell samples). For each cell sample, the theta phases of spikes in the preferred and non-preferred conditions were separately collected and the circular mean calculated. Cell samples analyzed were restricted to those with at least 20 spikes in the non-preferred condition, and with non-uniform phase histograms (Rayleigh tests at P < 0.05) in both conditions.
(C) Theta phase histogram (12-bin). Mean ± SEM (n = 132 cell samples).
(D) Theta phase histogram (2-bin). Mean ± SEM (n = 132 cell samples). (Note that preferred vs. non-preferred comparison would be expected to depend partly on locations of cells’ spatial firing fields.) Firing was higher in the 2nd half of the theta cycle in the non-preferred condition.
(E) Direction-coding cells. Plotting conventions follow (A). The cell in the middle column is same as that in the middle column in (A), instancing a cell with both location (left vs. right arms; Figures S1D-F) and direction (outbound vs. inbound direction; Figures S1G-I) selectivity. Note that, as in (A), spikes that occur in the non-preferred condition are shifted to the second half of theta (0 to π).
Recording regions, left to right: CA1, CA2, CA1.
(F-H), Directional firing theta phase quantification (n = 665 cell samples). Plotting conventions and comparisons follow (B-D). As in location (B-D), firing was higher in the 2nd half of the theta cycle in the non-preferred condition. Signed-rank tests.
P-values reported in main text.
***, P < 0.001.

