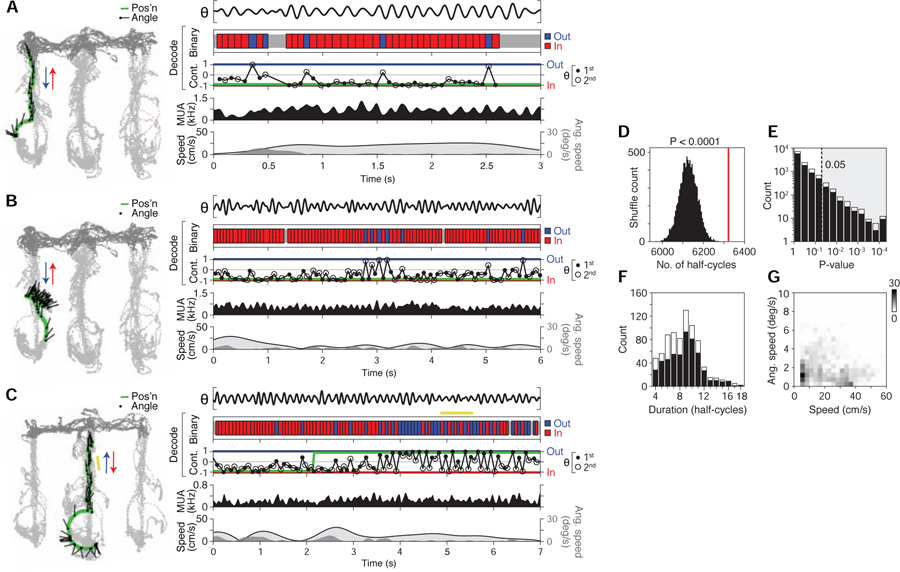
Figure 7. Constant cycling of heading direction.
(A-C) Three example maze passes showing various levels of half-theta cycling. Examples in (A) and (B) are from same recording epoch. In example (C), an individual period of constant half-theta cycling is highlighted (yellow bar).
(Left) Behavior plot. Position (green) and head angle (black lines; sampling period in plot: 133 ms) are overlaid on locations visited by the subject in the recording epoch (light grey: locations analyzed; dark grey: other locations).
(Right) Data and decoded representation.
Top section: LFP (θ, 5–11 Hz from CA3).
Second section: binary decoded output (red: inbound; blue: outbound).
Third section: continuous-valued decoded output (−1: inbound; 0: non-directional; 1: outbound) (filled circle: 1st half theta; open circle: 2nd half theta; connecting lines shown for visual clarity); green line denotes actual direction of subject.
Fourth section: multi-unit firing activity (MUA) smoothed with Gaussian kernel (σ = 20 ms).
Fifth section: linear (light grey fill trace) and angular (dark grey fill) speed of rat.
(D) Prevalence of constant (half-theta) cycling in observed (red line) vs. shuffled data (histogram, 10000 permutations; study-wide shuffle). Plotted is the total number of cycles participating in detected constant cycling periods. P < 0.0001 (0 out of 10000 shuffles had equal or greater prevalence of cycles).
(E) P-values of individual constant (half-theta) cycling periods (individual period shuffle). Shaded area enclosed by dotted line indicates criterion (P < 0.05) for individual periods analyzed subsequently in (F) and (G). Individual periods that occurred exclusively during movement (>4 cm/s) (black bars) versus those that overlapped with low speed periods (<4 cm/s for <0.5 s) (stacked white bars) are plotted separately.
(F) Histogram of durations (in half-cycles) of individual constant half-theta cycling periods. Bar plot convention follows that of (E).
(G) Behavioral speed during individual constant (half-theta) cycling periods. Data plotted as a 2D histogram, where greyscale value corresponds to count density (767 total periods plotted). Observed periods commonly occurred when angular speed was low (<10 deg/s), indicating that constant cycling could occur in the absence of overtly deliberative behavior (e.g. head scanning (Redish, 2016)).

