
Fig. 6.
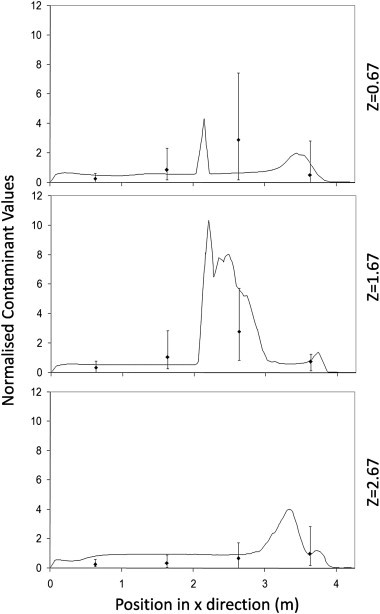
Normalised concentrations from the CFD simulations (lines) compared to experimental samples (points with error bars) along 3 separate lines passing through the test chamber for test run at 6 ac/h using a linear source.
Official websites use .gov
A
.gov website belongs to an official
government organization in the United States.
Secure .gov websites use HTTPS
A lock (
) or https:// means you've safely
connected to the .gov website. Share sensitive
information only on official, secure websites.
Normalised concentrations from the CFD simulations (lines) compared to experimental samples (points with error bars) along 3 separate lines passing through the test chamber for test run at 6 ac/h using a linear source.