
Fig. 7.
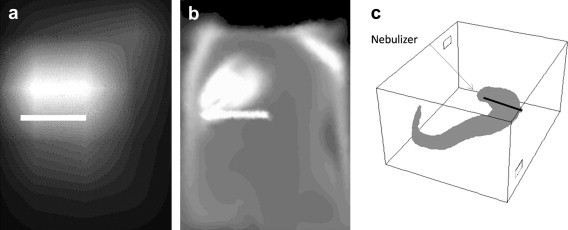
Contours of bioaerosols from the linear source. Values on plane y = 1.15 m a) experimental results, b) CFD results. c) Plume showing 3D dispersal pattern from CFD results. Orientation as plan in Fig. 1.
Official websites use .gov
A
.gov website belongs to an official
government organization in the United States.
Secure .gov websites use HTTPS
A lock (
) or https:// means you've safely
connected to the .gov website. Share sensitive
information only on official, secure websites.
Contours of bioaerosols from the linear source. Values on plane y = 1.15 m a) experimental results, b) CFD results. c) Plume showing 3D dispersal pattern from CFD results. Orientation as plan in Fig. 1.