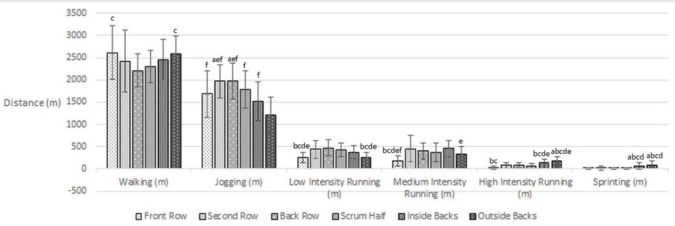
Figure 2.

Total distances covered (m) in speed threshold zones based on specific positional groups. Indicates significantly different distance from a front row; b second row; c back row; d scrum half; e inside backs; f outside backs.

Total distances covered (m) in speed threshold zones based on specific positional groups. Indicates significantly different distance from a front row; b second row; c back row; d scrum half; e inside backs; f outside backs.