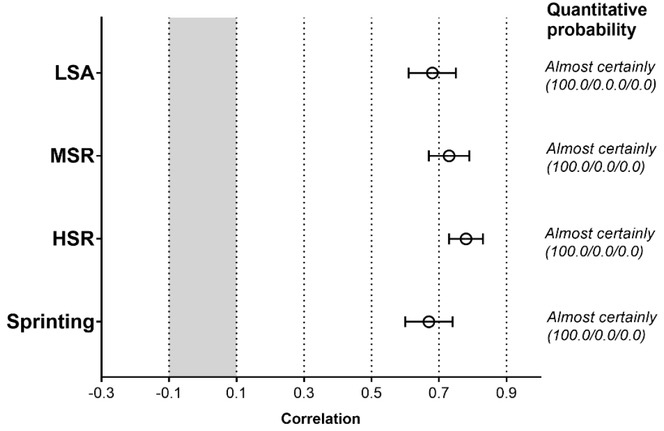
Figure 3.

Within-subject correlations between distance covered in arbitrary and individualized speed zones (n = 302 training observations). LSA = low-speed activity, MSR= moderate-speed running, HSR = high-speed running. The grey-filled space represents an unclear correlation (p ≤ 0.05, r < 0.1). Dotted lines delimitate the magnitude of correlations.
