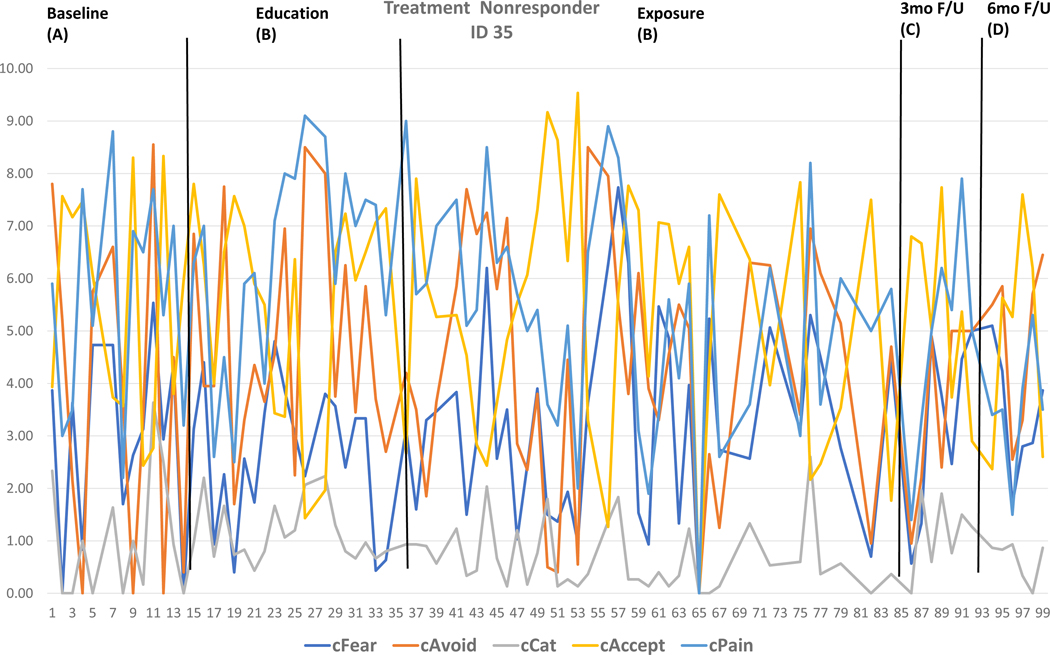
Figure 4. Raw data from Treatment Non-responder.
The raw daily diary data across outcomes and timepoints for a Treatment Non-responder is depicted for visual inspection and descriptive analysis. Via visual inspection, no improvements are observed across outcomes. Via individual effect size calculations, when comparing baseline to 6-month follow-up (means phase A minus means phase D), Pain=2.22 (0.78) improved with medium individual effects. No other outcomes or significant effects were observed. Detailed individual data combining visual inspection and effect size calculation affords a focused view of the data that can immediately inform treatment delivery for this specific participant.

