
Fig. 7.
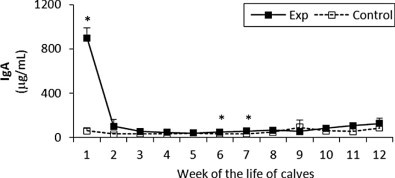
IgA concentration in sera of experimental and control calves from the 1st to 12th week of the animal life. *Significant differences (p < 0.05) within the two groups of calves. Exp, experimental calves; Control, control calves.
Official websites use .gov
A
.gov website belongs to an official
government organization in the United States.
Secure .gov websites use HTTPS
A lock (
) or https:// means you've safely
connected to the .gov website. Share sensitive
information only on official, secure websites.
IgA concentration in sera of experimental and control calves from the 1st to 12th week of the animal life. *Significant differences (p < 0.05) within the two groups of calves. Exp, experimental calves; Control, control calves.