
Fig. 7.
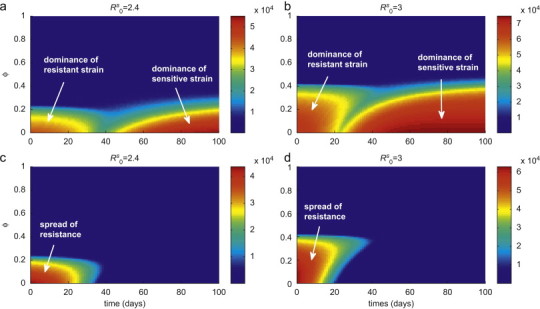
The combined effect of clustering degree and changing treatment level during the outbreak, on the total number of infections caused by both sensitive and resistant strains. Simulations were run with an initial treatment level of 20% and then changed to 80% at the time displayed on the horizontal axis (corresponding to the time-course of the outbreak). Other parameter values are given in Table 2. The colour bars in (a) and (b) illustrate the total number of infections with and 3, respectively. The corresponding total numbers of resistant infections are shown by colour bars in (c) and (d). (For interpretation of the references to colour in this figure legend, the reader is referred to the web version of this article.)