
Fig. 5.
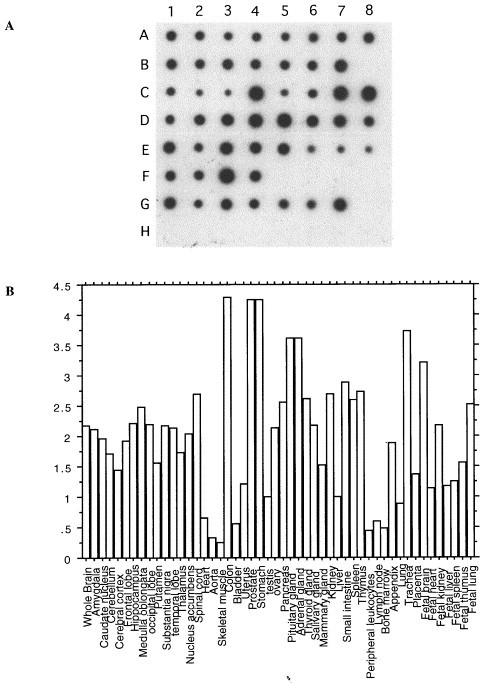
mRNA dot blot analysis of GP73 expression in multiple human tissues. (A) RNA dot blots: mRNA from 50 normal human tissues was spotted onto a nitrocellulose membrane, and probed with a cDNA probe directed against GP73 as described in Section 2. The samples are arranged as follows: A1–8 (whole brain, amygdala, caudate nucleus, cerebellum, cerebral cortex, frontal lobe, hippocampus, medulla oblongata); B1–7 (occipital lobe, putamen, substantia nigra, temporal lobe, thalamus, nucleus acumbens, spinal cord); C1–8 (heart, aorta, skeletal muscle, colon, bladder, uterus, prostate, stomach); D1–8 (testis, ovary, pancreas, pituitary gland, adrenal gland, thyroid gland, salivary gland, mammary gland); E1–8 (kidney, liver, small intestine, spleen, thymus, peripheral leukocyte, lymph node, bone marrow); F1–4 (appendix, lung, trachea, placenta); G1–7 (fetal brain, fetal heart, fetal kidney, fetal liver, fetal spleen, fetal thymus, fetal lung). H1–7 contain control samples that are not expected to yield hybridization signals (100 ng yeast total RNA, 100 ng yeast tRNA, 100 ng Escherichia coli rRNA, 100 ng E. coli DNA, 100 ng Poly r(A), 100 ng human Cot1DNA, 100 ng human DNA, 500 ng human DNA). (B) Quantification of the results obtained in (A). The autoradiogram shown in (A) was evaluated by densitometry, as described in Section 2. GP73 signals (corrected for the corresponding ubiquitin signals) are expressed relative to the signal obtained in normal liver.