
Fig. 6.
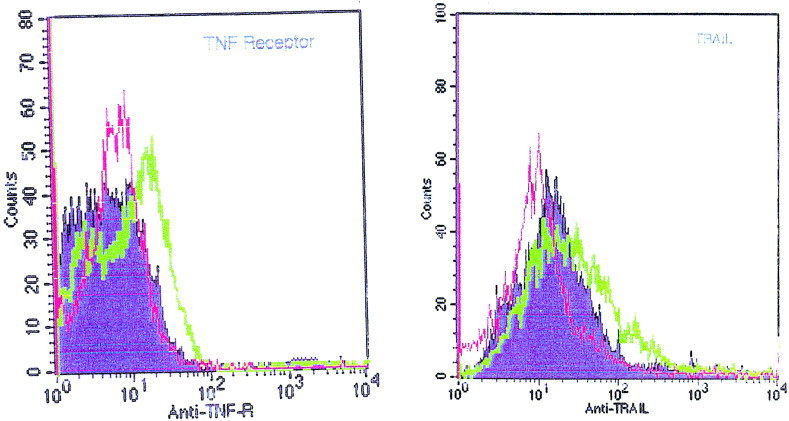
Expression of cytoplasmic TRAIL protein and cell surface TNF-R in astrocytes as determined by flow cytometry. Cells were mock-infected or infected with the nonneurovirulent strain BeAn (shaded profiles), or infected at an m.o.i. of 10 with GDVII virus for 8 h (thick lines). Stainings obtained with normal goat IgG or rabbit serum instead of primary antibodies are shown (thin lines) as negative controls. The font sizes are different in the two panels (80 and 100 counts).