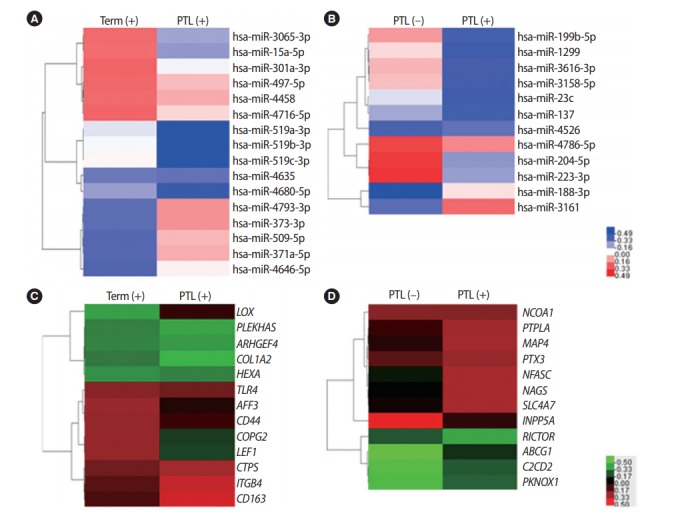
Figure 1.

Heatmap of hierarchical clustering. Heatmaps illustrating the differentially-expressed microRNAs (miRNAs; A, B) and genes (C, D) in placentas of each group. Term with inflammation (term (+), n = 2), preterm without inflammation (PTL (–), n = 3), and preterm with inflammation (PTL (+), n = 2) compared to normal-term without inflammation (term (–), n = 6). Red represents upregulated miRNAs and genes. Blue and green represent downregulated miRNAs and genes. PTL, preterm labor.
