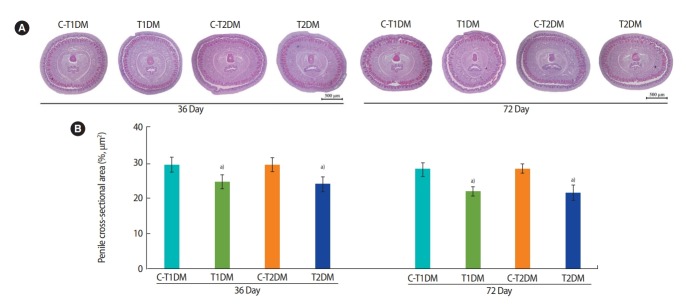
Figure 10.
(A) Representative penile histology as shown by H&E staining and (B) percentage of the penile cross-sectional area compared among type 1 diabetes mellitus control (C-T1DM), type 1 DM (T1DM), type 2 DM control (C-T2DM), and type 2 DM (T2DM) mice on experimental days 36 and 72. Values are presented as mean ± standard deviation. a)p< 0.05 compared with controls.

