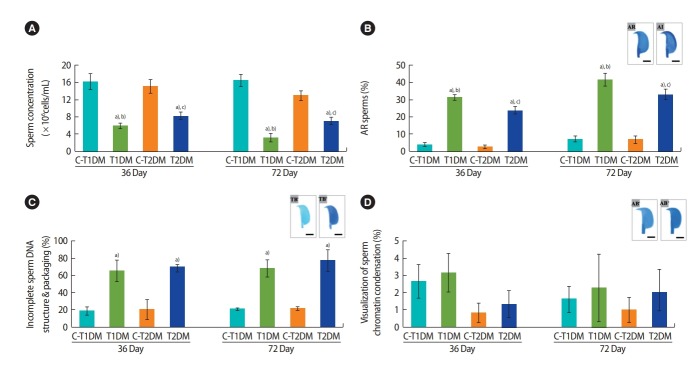
Figure 2.
Comparisons among type 1 diabetes mellitus control (C-T1DM), type 1 DM (T1DM), type 2 DM control (C-T2DM), and type 2 DM (T2DM) mice on experimental days 36 and 72. (A) Sperm concentration. (B) Acrosome reaction. Top right: representative photographs of acrosome-intact (AI) sperm stained with 0.22% Coomassie blue G-250 and acrosome-reacted (AR) sperm without staining. (C) Incomplete sperm DNA structure and packaging. Top right: toluidine blue-reacted (TB+) sperm indicating sperm with abnormal chromatin versus sperm with normal chromatin (TB–). (D) Visualization of sperm chromatin condensation. Top right: aniline blue-reacted (AB+) sperm indicating chromatin defects of sperm nuclei versus normal sperm (AB–). Values are presented as mean ± standard deviation. Scale bar, 1 μm. a)p< 0.05 compared with control; b)p< 0.05 compared with T2DM; c)p< 0.05 compared with T1DM.

