Figure 6.
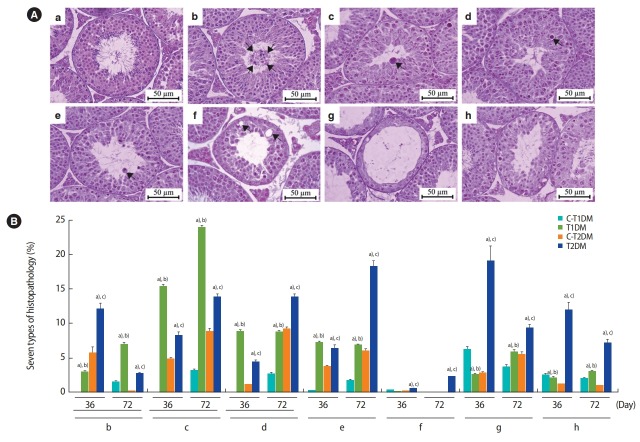
(A) Representative photomicrographs showing normal histology and histopathology. (a) Control group; normal arrangement of spermatogenic and Sertoli cells. (b-h) Histopathological findings of the seminiferous tubules found in the type 1 and type 2 diabetes mellitus (T1DM and T2DM) groups. (b) Sloughing of deciduous and spermatogenic cells (arrows) into the tubular lumen. (c) Cell with large nuclei (arrow) in the seminiferous epithelium. (d) Cell with small nuclei and vacuolization (arrow) in the seminiferous epithelium. (e) Few spermatogenic cell layers of artifactual sloughing (arrow) of germ cell elements into the lumen. (f) Vacuolization (arrows) of Sertoli cells and absence of spermatids. (g) Atrophy with germ cell degeneration and small vacuolization between spermatogonia and Sertoli cells. (h) Hypospermatogenesis with all germ layers diminished. (B) Seven histopathology types by percentage. Values are presented as mean ± standard deviation. C-T1DM, type 1 diabetes mellitus control; C-T2DM, type 2 DM control. a)p< 0.05 compared with controls; b)p< 0.05 compared with T2DM; c)p< 0.05 compared with T1DM.

