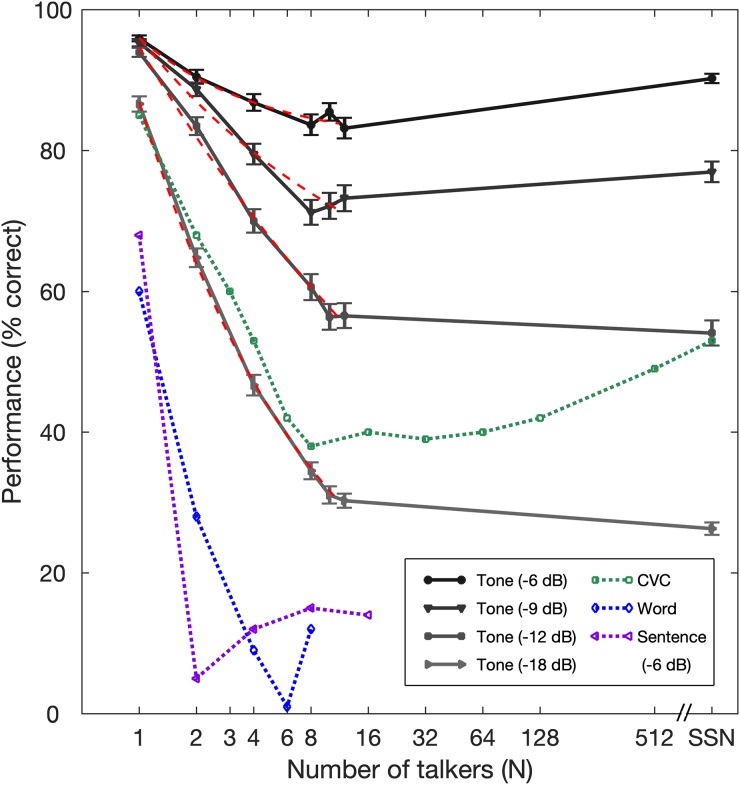
Fig. 3.
(Color online) Group mean speech-recognition scores as a function of N of MTBs. Recognition performance in SSN is arbitrarily plotted beyond N = 512. Solid lines with filled symbols are tone-recognition scores at different SNRs in the present study. Error bars indicate ±1 S.E. Dashed lines without symbols are fitted curves from the exponential regression. Dotted lines with unfilled symbols are speech-recognition scores with different speech materials from previous studies on the English language: VCV syllables (Simpson and Cooke, 2005), words (Miller, 1947), and sentences (Rosen et al., 2013).

