
Fig. 5. Inhibition of fatty acid oxidation impairs protumor function of TAMs.
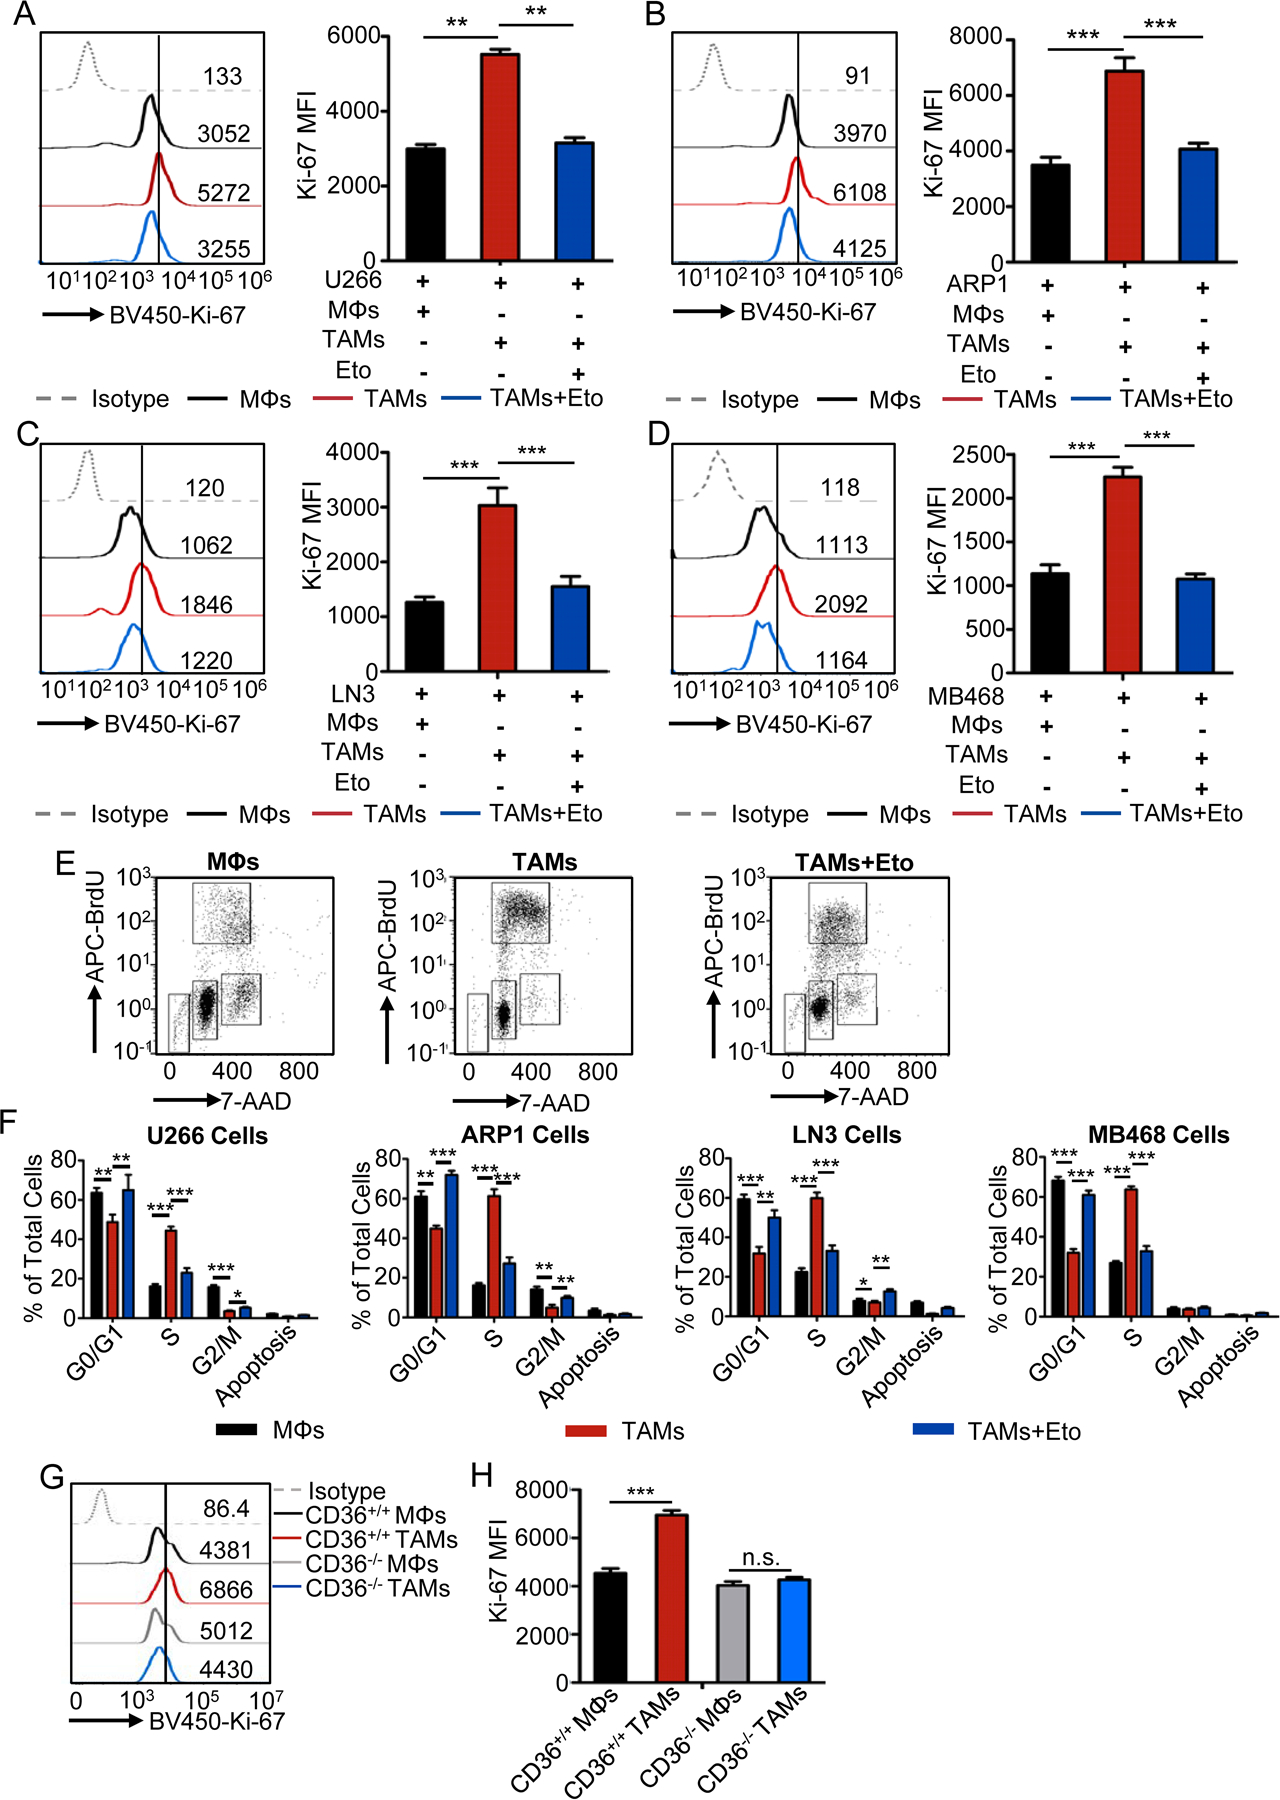
A-D, Representative histograms (left) and statistic results (right) of the expression of Ki-67 in human U266 (A) and ARP1 (B) myeloma cells, LNCap-LN3 prostate tumor cells (C), and MDA-MB-468 breast tumor cells (D), cultured with control MΦs or TAMs in the presence or absence of etomoxir. Statistical significance was determined by two-tailed Student’s t test between indicated groups. **, P < 0.01; ***, P < 0.001.
E, Representative dot plots showing cell cycle progression of tumor cells with indicated coculture conditions using APC-BrdU and 7-AAD.
F, Bar graphs showing the percentage of human U266, ARP1, LNCaP-LN3, and MDA-MB-468 cells in the indicated cell cycle stages under indicated coculture conditions. Statistical significance was determined by two-tailed Student’s t test between indicated groups. *, P < 0.05; **, P < 0.01; ***, P < 0.001.
G-H, Representative histograms (G) and statistic results (H) showing the expression of Ki-67 in 5TGM1 cells cultured with control MΦs or TAMs from CD36 WT and KO mice. Statistical significance was determined by two-tailed Student’s t test between indicated groups. ***, P < 0.001; n.s., not significant.